library(ggplot2)
library(dplyr)
Attaching package: 'dplyr'The following objects are masked from 'package:stats':
filter, lagThe following objects are masked from 'package:base':
intersect, setdiff, setequal, unionInvestigating the books dataset within quarto
library(ggplot2)
library(dplyr)
Attaching package: 'dplyr'The following objects are masked from 'package:stats':
filter, lagThe following objects are masked from 'package:base':
intersect, setdiff, setequal, unionbooks <- read.csv("../../../../data/books.csv")names(books) [1] "X" "bookID" "title"
[4] "authors" "average_rating" "isbn"
[7] "isbn13" "language_code" "num_pages"
[10] "ratings_count" "text_reviews_count" "publication_date"
[13] "publisher" books |>
ggplot(mapping = aes(x = language_code)) +
geom_bar()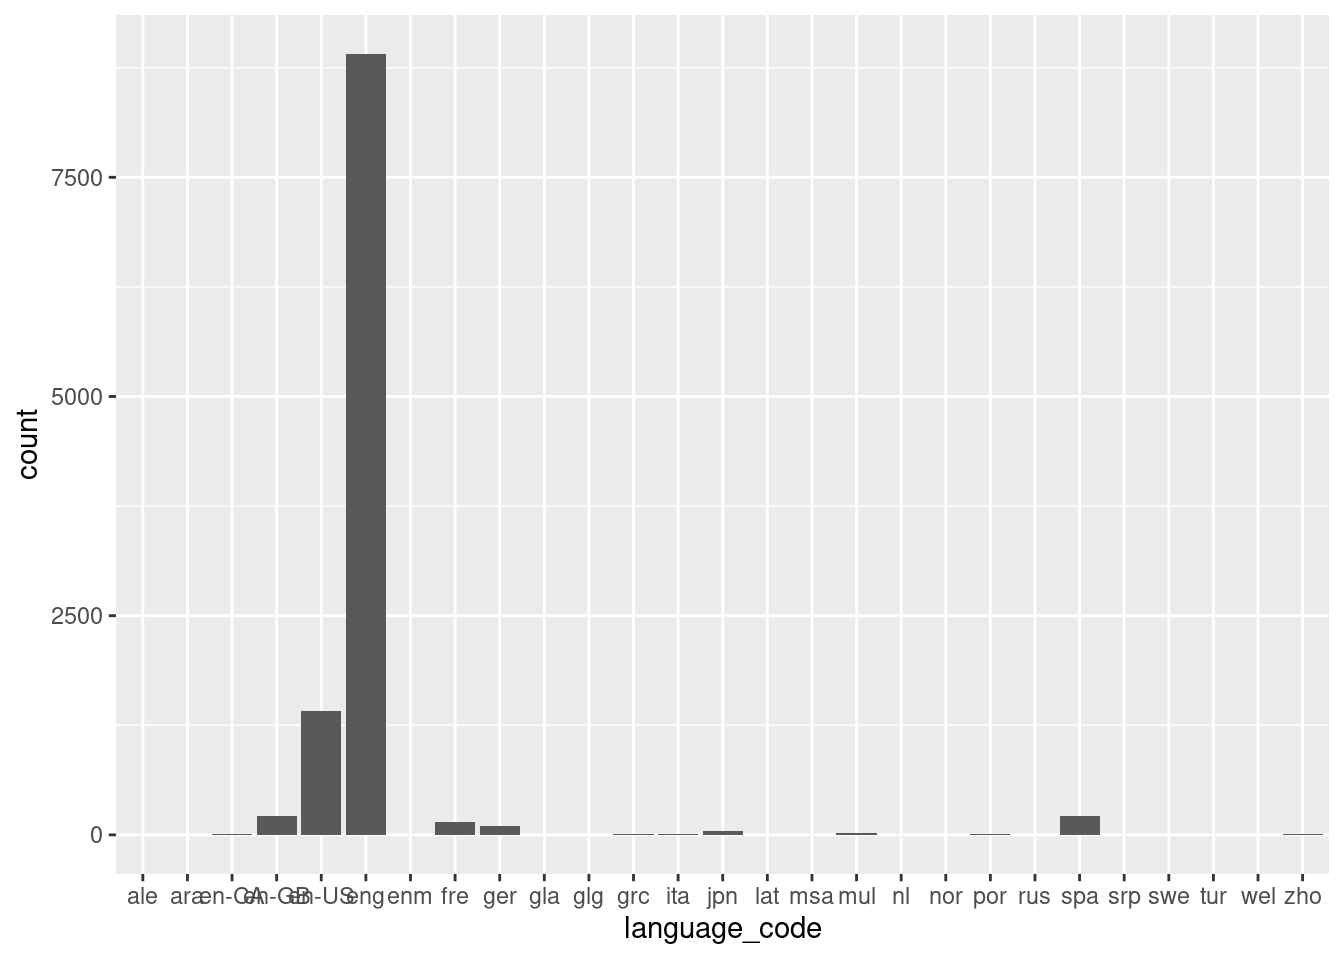
non_english_books <- filter(books,!language_code %in% c("en-US","eng"))
non_english_books |>
  ggplot(mapping = aes(x = language_code)) +
  geom_bar()
#| fig-cap: "Number of Non-English Books Published"ggplot(data = non_english_books,
mapping = aes(x = num_pages,
y = publisher)) +
geom_point()