library(dplyr)Book Report
R
25Winter
data: books.csv
Data set
We took a deep dive into our books data set. We have captured authors, publishers, and ratings.
Exlporing the data set
First we told R to use dplyr
Then we told R to look at our dataset
read.csv("../../../../data/books.csv")Then we asked R to make an object called Books
Books <- read.csv("../../../../data/books.csv")Next we asked a series of questions about the data:
- What is the range of page numbers?
range(Books$num_pages)[1] 0 6576- What is the range of rating counts?
range(Books$ratings_count)[1] 0 4597666- What publishers were used in the data set?
library(ggplot2)??Booksstr(Books)'data.frame': 11125 obs. of 13 variables:
$ X : int 1 2 3 4 5 6 7 8 9 10 ...
$ bookID : int 1 2 4 5 8 9 10 12 13 14 ...
$ title : chr "Harry Potter and the Half-Blood Prince (Harry Potter #6)" "Harry Potter and the Order of the Phoenix (Harry Potter #5)" "Harry Potter and the Chamber of Secrets (Harry Potter #2)" "Harry Potter and the Prisoner of Azkaban (Harry Potter #3)" ...
$ authors : chr "J.K. Rowling/Mary GrandPré" "J.K. Rowling/Mary GrandPré" "J.K. Rowling" "J.K. Rowling/Mary GrandPré" ...
$ average_rating : num 4.57 4.49 4.42 4.56 4.78 3.74 4.73 4.38 4.38 4.22 ...
$ isbn : chr "0439785960" "0439358078" "0439554896" "043965548X" ...
$ isbn13 : num 9.78e+12 9.78e+12 9.78e+12 9.78e+12 9.78e+12 ...
$ language_code : chr "eng" "eng" "eng" "eng" ...
$ num_pages : int 652 870 352 435 2690 152 3342 815 815 215 ...
$ ratings_count : int 2095690 2153167 6333 2339585 41428 19 28242 3628 249558 4930 ...
$ text_reviews_count: int 27591 29221 244 36325 164 1 808 254 4080 460 ...
$ publication_date : chr "2006-09-16" "2004-09-01" "2003-11-01" "2004-05-01" ...
$ publisher : chr "Scholastic Inc." "Scholastic Inc." "Scholastic" "Scholastic Inc." ...First, using a scatterplot:
ggplot(data = Books,
       mapping = aes(x = X,
                     y = publisher))+
  geom_point()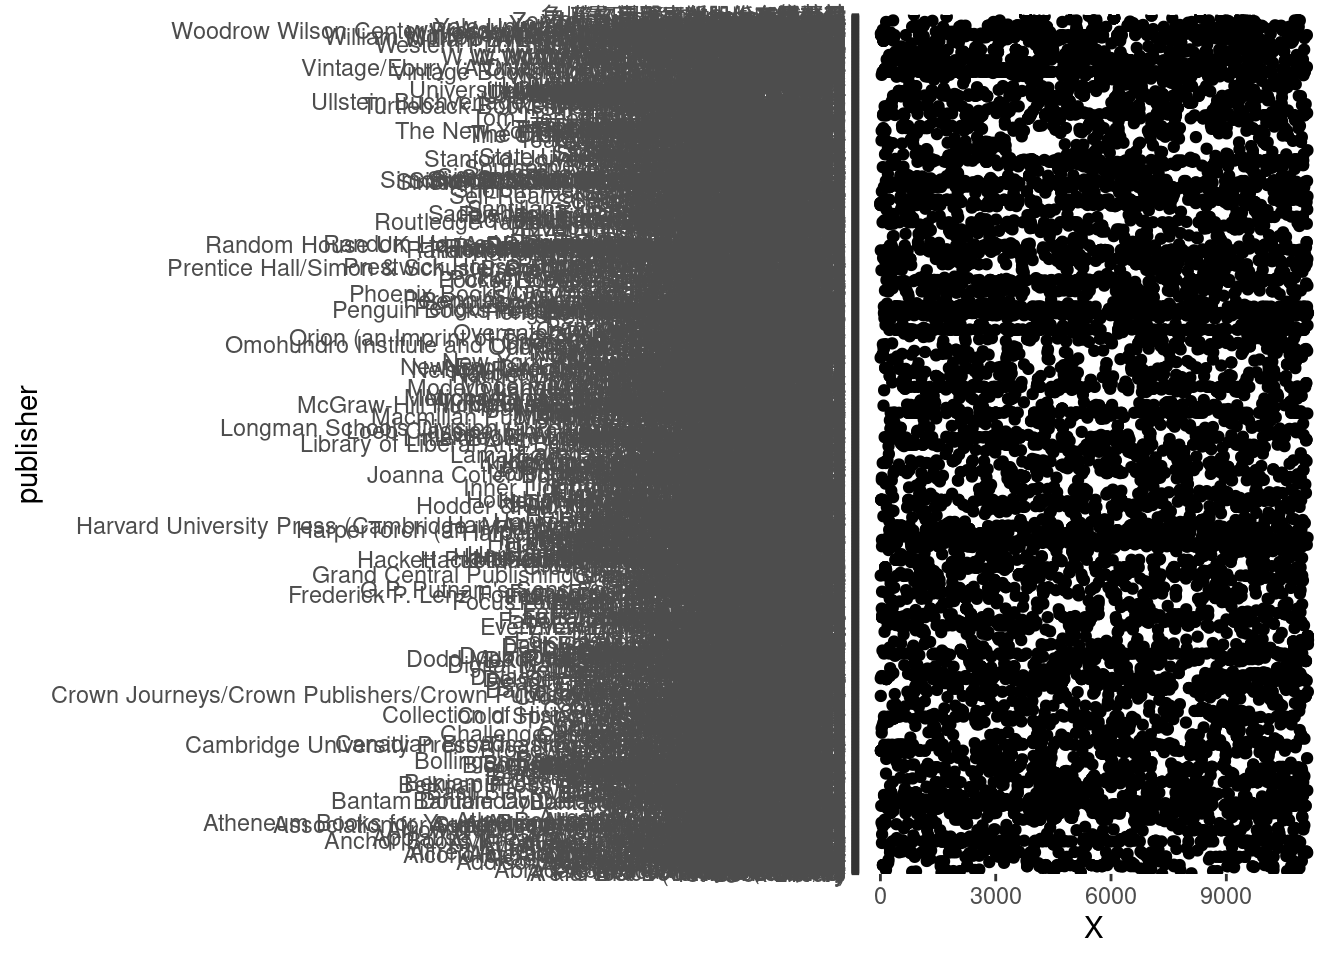
Second, using a bar graph:
ggplot(data=Books,
       mapping=aes(x=publisher))+
  geom_bar()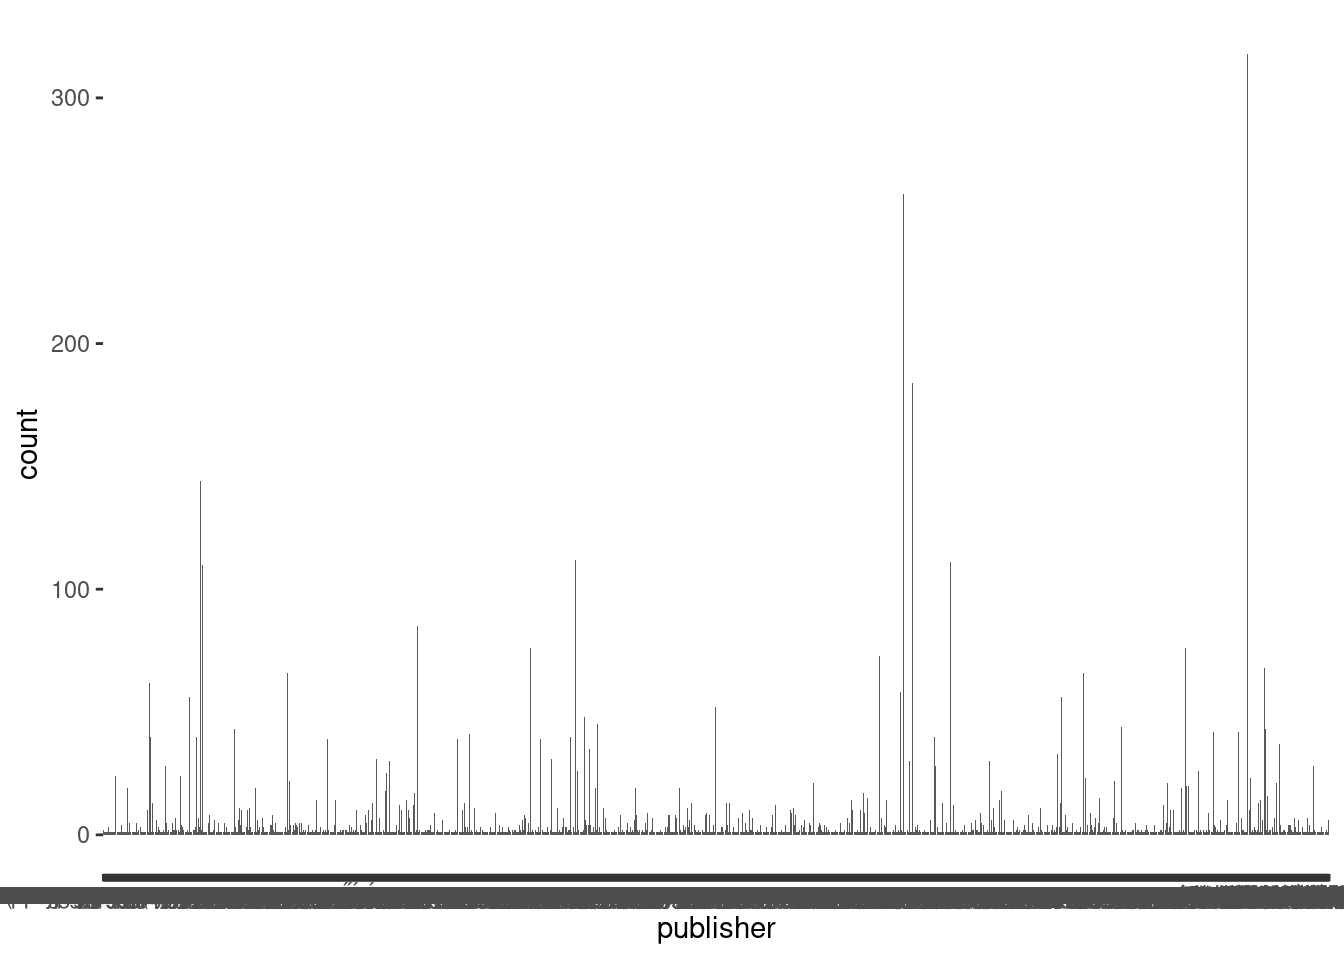
Third, we were only interested in publishers of books with less than 5 pages
Books%>%
    filter(num_pages<5)%>%
    ggplot(mapping=aes(y=publisher))+
  geom_bar()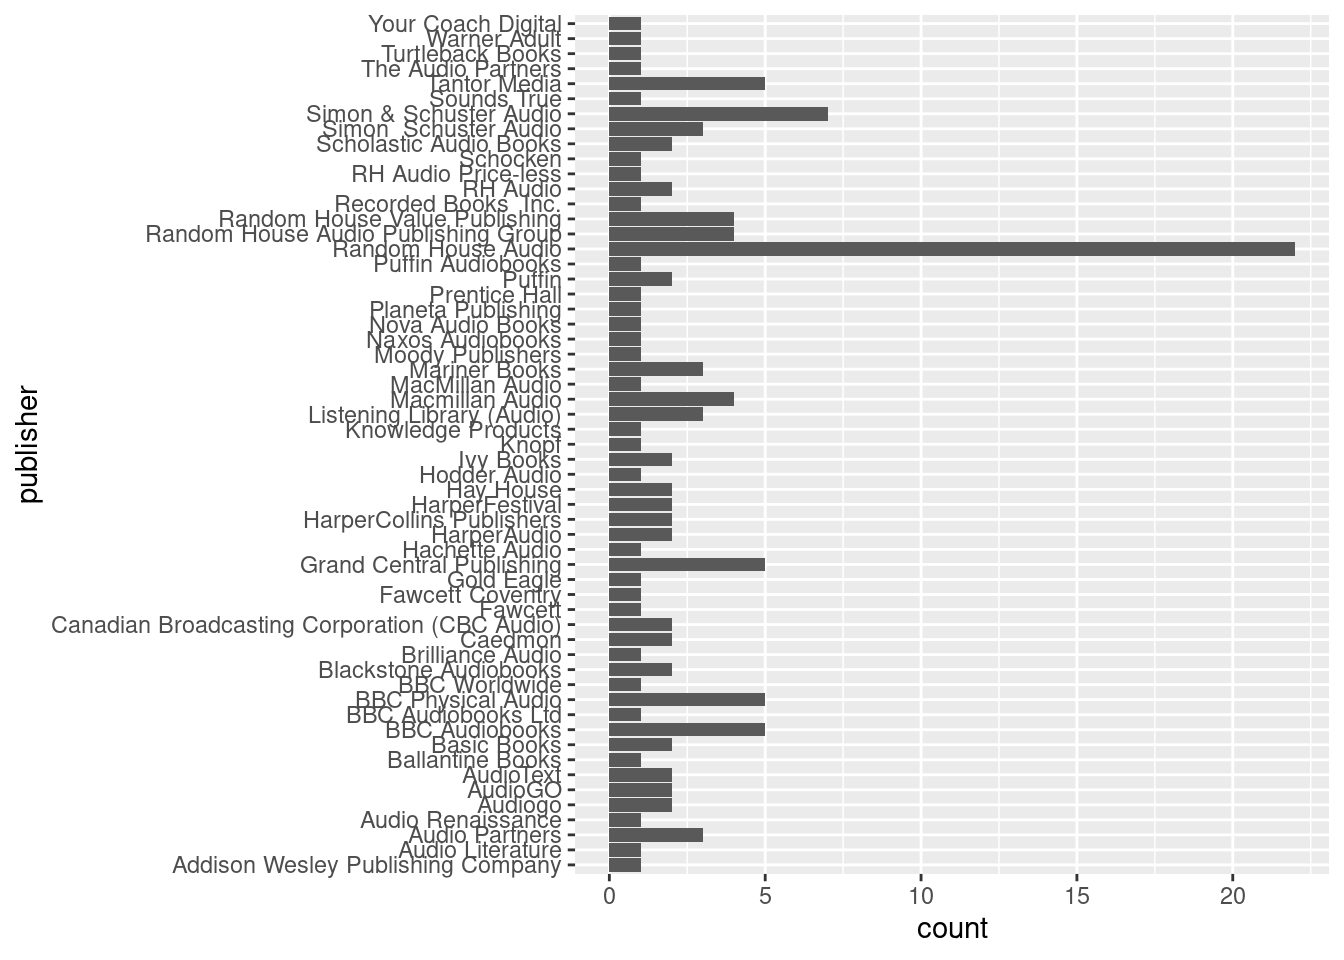
Fourth, we were interested in books published by Scholastic
Books%>%
    filter(grepl("Scholastic", publisher))%>%
    ggplot(mapping=aes(y=publisher))+
  geom_bar()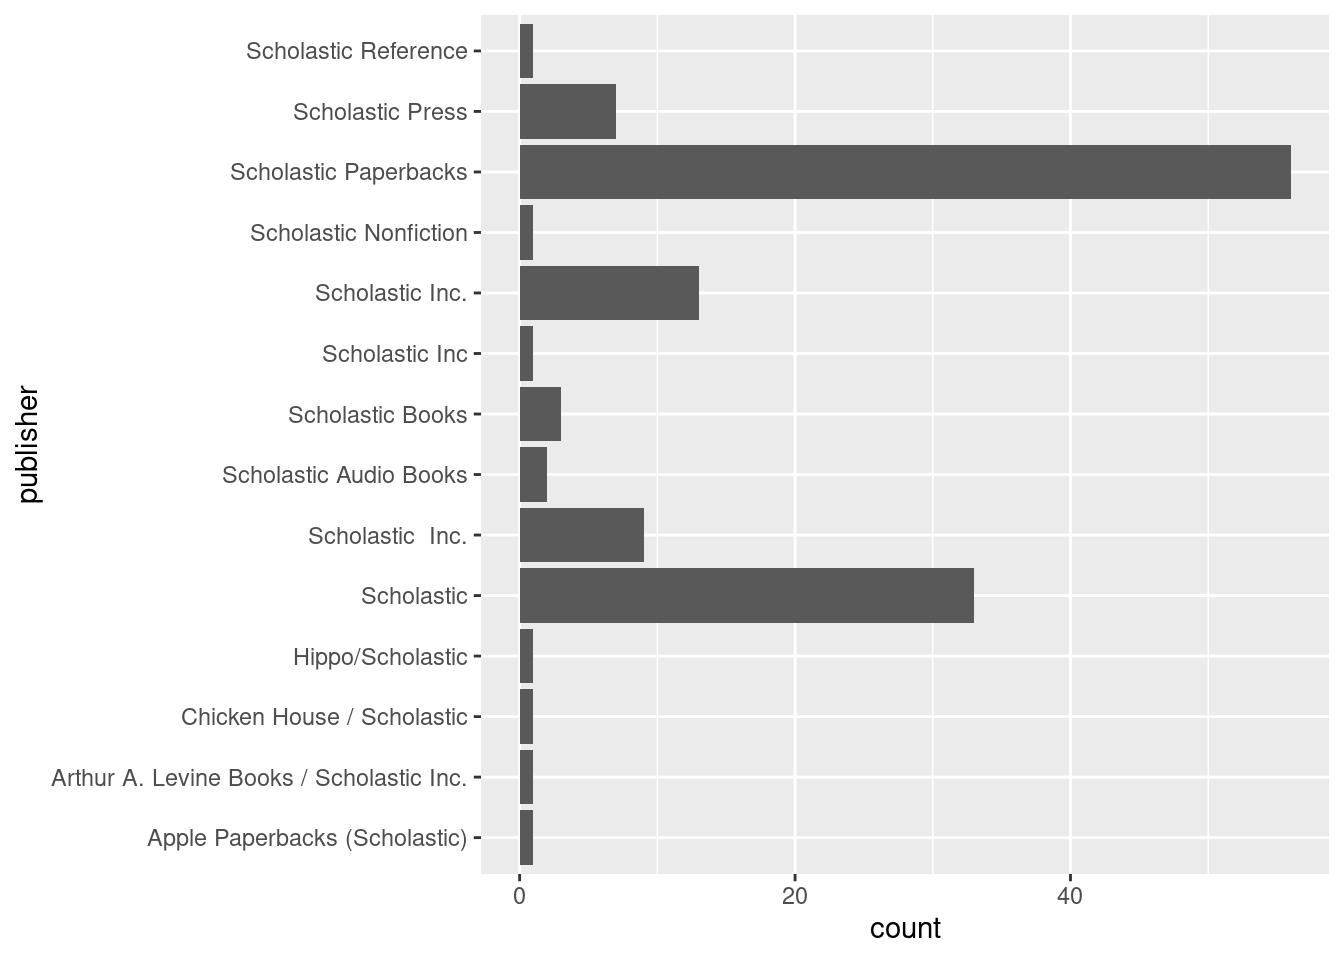
- Are rating counts associated with number of pages?
cor.test(Books$num_pages,Books$ratings_count)
    Pearson's product-moment correlation

data:  Books$num_pages and Books$ratings_count
t = 3.6288, df = 11123, p-value = 0.000286
alternative hypothesis: true correlation is not equal to 0
95 percent confidence interval:
 0.01581461 0.05293589
sample estimates:
       cor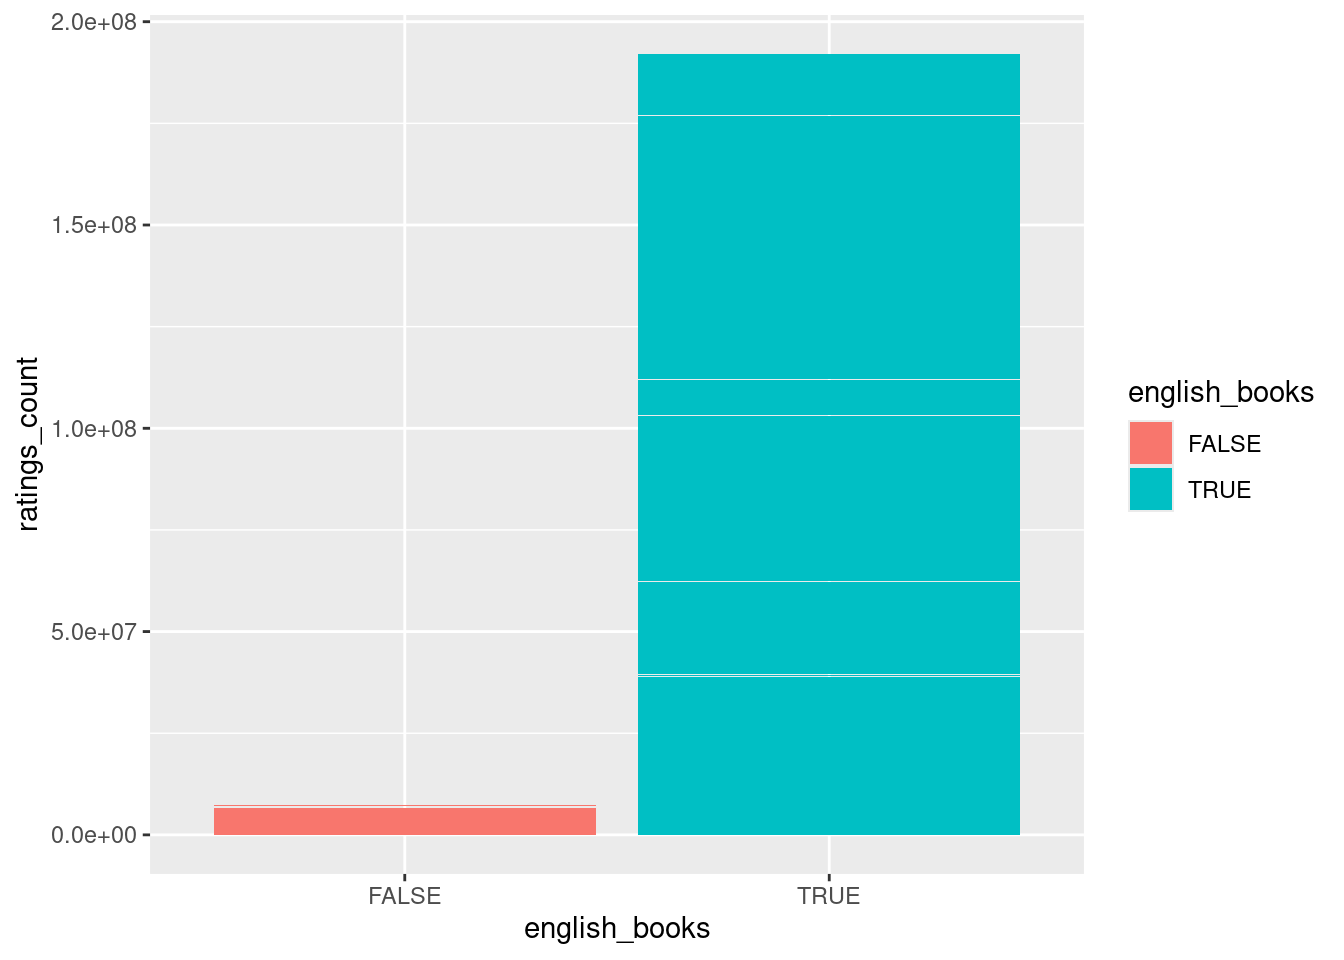
0.03438711 - Compare ratings counts for books in English versus books not in English?
First we must create a categorical variable English vs. Non-English
Books <- Books |>
  mutate(english_books=language_code=="eng")
Now we can run a t-test to compare ratings counts
t.test(ratings_count~english_books,data=Books)
    Welch Two Sample t-test

data:  ratings_count by english_books
t = -13.323, df = 9894.7, p-value < 2.2e-16
alternative hypothesis: true difference in means between group FALSE and group TRUE is not equal to 0
95 percent confidence interval:
 -20888.91 -15530.46
sample estimates:
mean in group FALSE  mean in group TRUE
           3354.563           21564.247
Now lets visualise it
library(ggplot2)ggplot(Books,
aes(x=english_books,y=ratings_count,
fill=english_books))+
geom_col()