fuel <- read.csv("../../../../data/qld_fuel.csv")
library(ggplot2)
library(dplyr)QLD Fuel
R
25Winter
data: qld_fuel.csv
Import the dataset & load packages
Distribution of Fuel Sites, grouped by Fuel type
fuel |>
  ggplot(aes(x = Site_Latitude, y = Site_Longitude)) +
  geom_jitter(aes(colour = Fuel_Type, label = Site_Suburb))
Warning in geom_jitter(aes(colour = Fuel_Type, label = Site_Suburb)): Ignoring
unknown aesthetics: label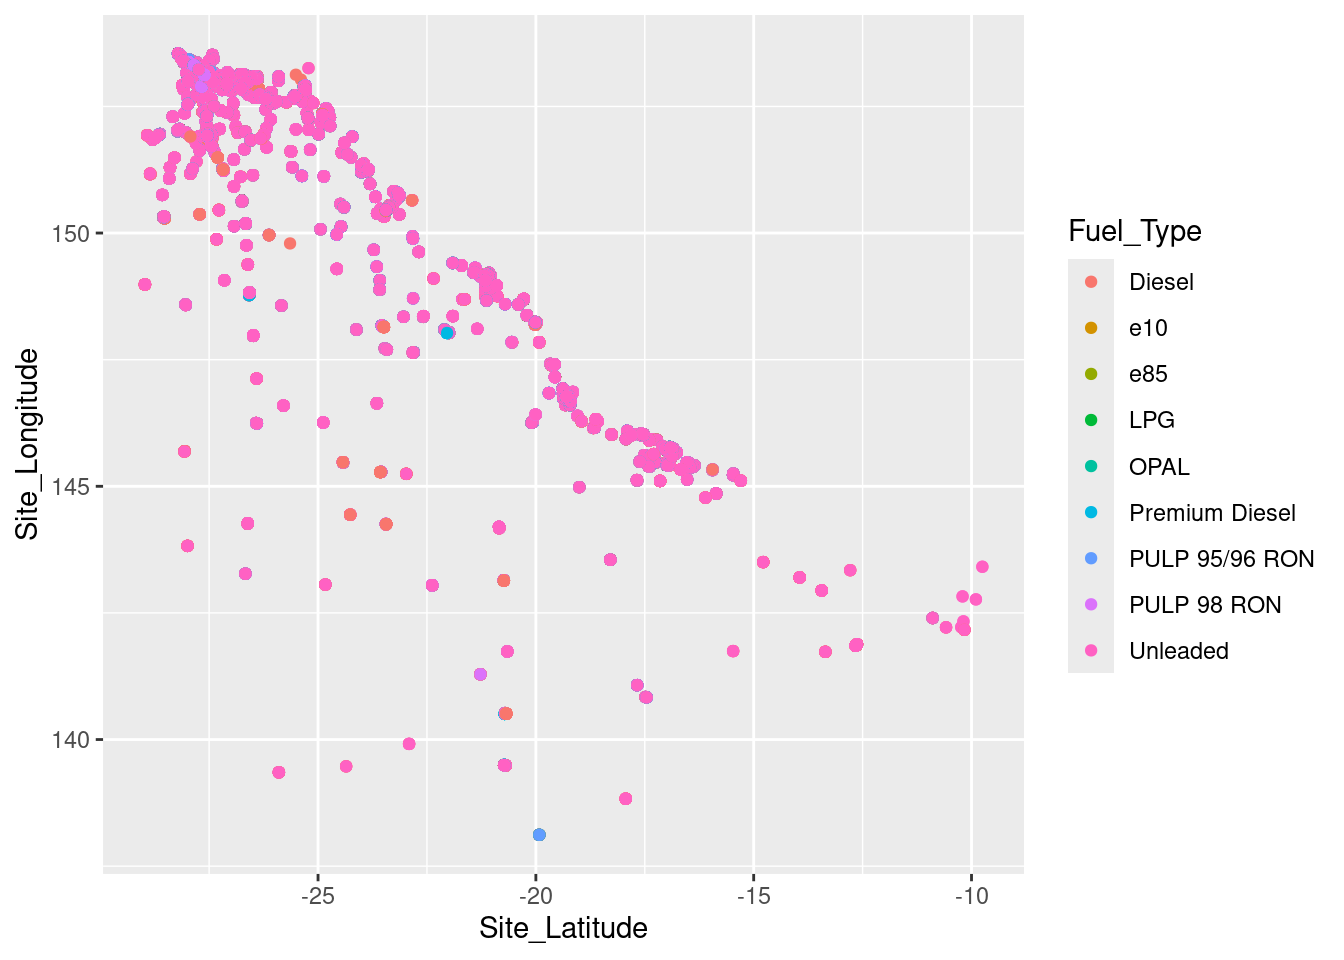
Most popular Fuel Type
fuel |>
  ggplot(aes(x = Fuel_Type)) +
  geom_bar()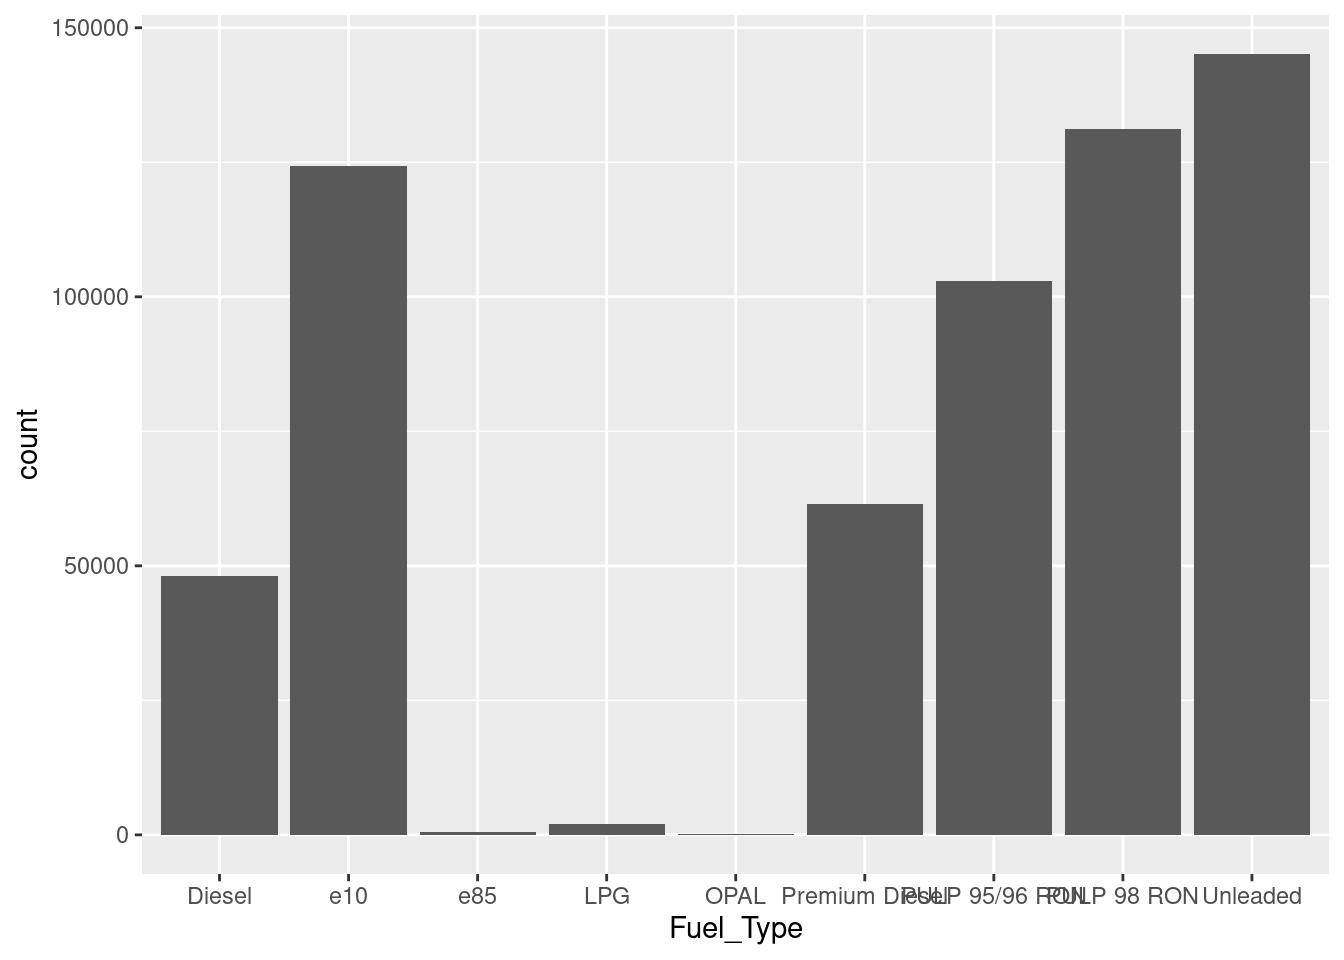
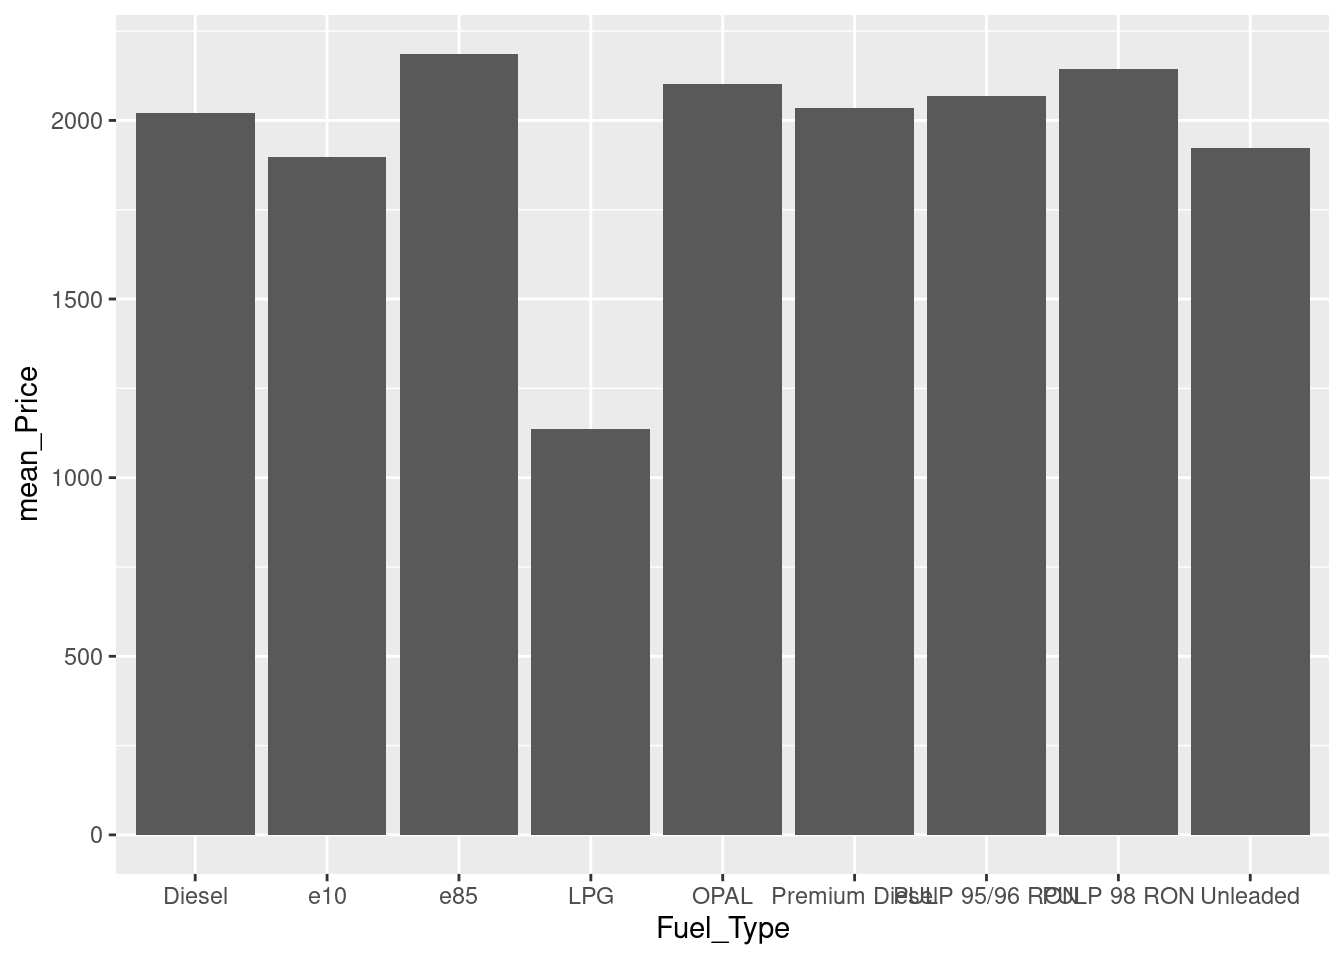
Price by Fuel Type
fuel |>
  group_by(Fuel_Type) |>
  summarise(mean_Price = mean(Price)) |>
  ggplot() +
  geom_col(aes(y = mean_Price, x = Fuel_Type))