Report_ben

R
25Winter
data: books.csv
Published

July 1, 2025

The goal: To find out the worst book(in English) published in the last 20 years based on Goodreads data set.

Loading Dataset and library

books <- read.csv(file = "data/books.csv")
#| message: false
#| results: false
library(tidyverse)
── Attaching core tidyverse packages ──────────────────────── tidyverse 2.0.0 ──
✔ dplyr     1.1.4     ✔ readr     2.1.5
✔ forcats   1.0.0     ✔ stringr   1.5.1
✔ ggplot2   3.5.2     ✔ tibble    3.2.1
✔ lubridate 1.9.4     ✔ tidyr     1.3.1
✔ purrr     1.0.4     
── Conflicts ────────────────────────────────────────── tidyverse_conflicts() ──
✖ dplyr::filter() masks stats::filter()
✖ dplyr::lag()    masks stats::lag()
ℹ Use the conflicted package (<http://conflicted.r-lib.org/>) to force all conflicts to become errors
library(ggplot2)
library(dplyr)
library(plotly)

Attaching package: 'plotly'

The following object is masked from 'package:ggplot2':

    last_plot

The following object is masked from 'package:stats':

    filter

The following object is masked from 'package:graphics':

    layout

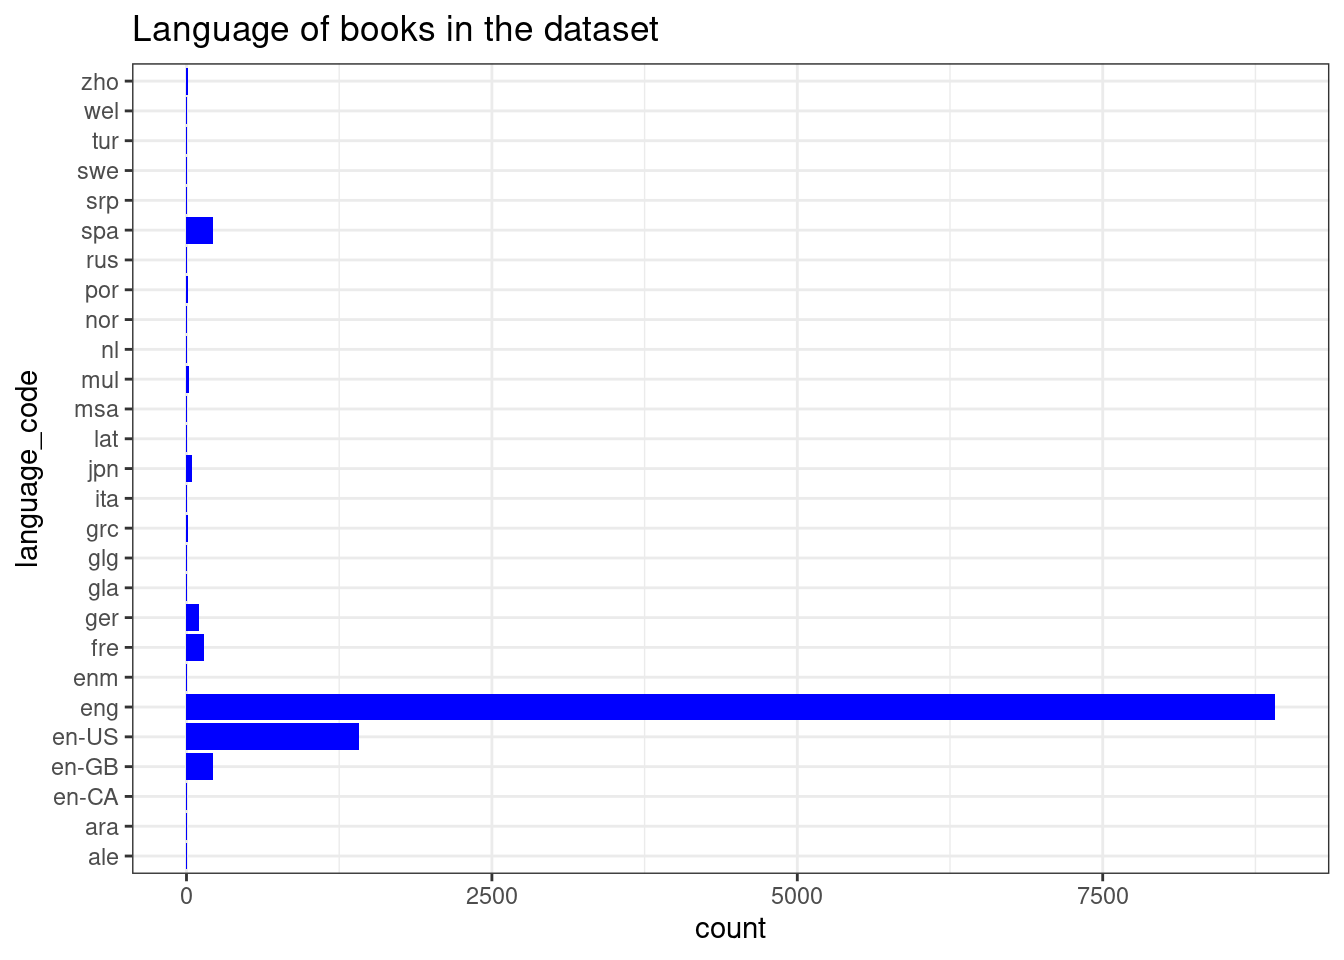
Looking at the dataset

ggplot(books, aes(y = language_code)) + 
  geom_bar(fill = "blue") +
  theme_bw()+
  labs(title = "Language of books in the dataset")

We have found that the datasets countain books from different languages.

Filter the books in English and combine them

books_eng <- books %>% 
  mutate(Eng = language_code == "eng" |
           language_code == "en-US" |
           language_code == "en-CA" |
           language_code == "en-GB") %>% 
  filter(Eng == 1)

books_eng %>% 
ggplot(aes(y = language_code)) + 
  geom_bar(fill = "tomato") +
  theme_bw()+
  labs(title = "Plot checking filter worked")

Based on the website https://www.goodreads.com/list/show/24328. filter rating <3.6, at least >100 ratings count.

books_eng_cleaned <- books_eng %>% 
  filter(average_rating < 3.6 , publication_date > 2005, ratings_count >100) 

And the Worst book in the past 20 year is…

rating <- books_eng_cleaned %>% 
  filter(average_rating == min(average_rating))

print(paste("The lowest rating book is", rating$title, "by", 
      rating$authors))
[1] "The lowest rating book is Citizen Girl by Emma McLaughlin/Nicola Kraus"
people <- books_eng_cleaned %>% 
  filter(ratings_count == max(ratings_count))

print(paste("The book that most people hate is", people$title, "by", people$authors))
[1] "The book that most people hate is Twilight (Twilight  #1) by Stephenie Meyer"

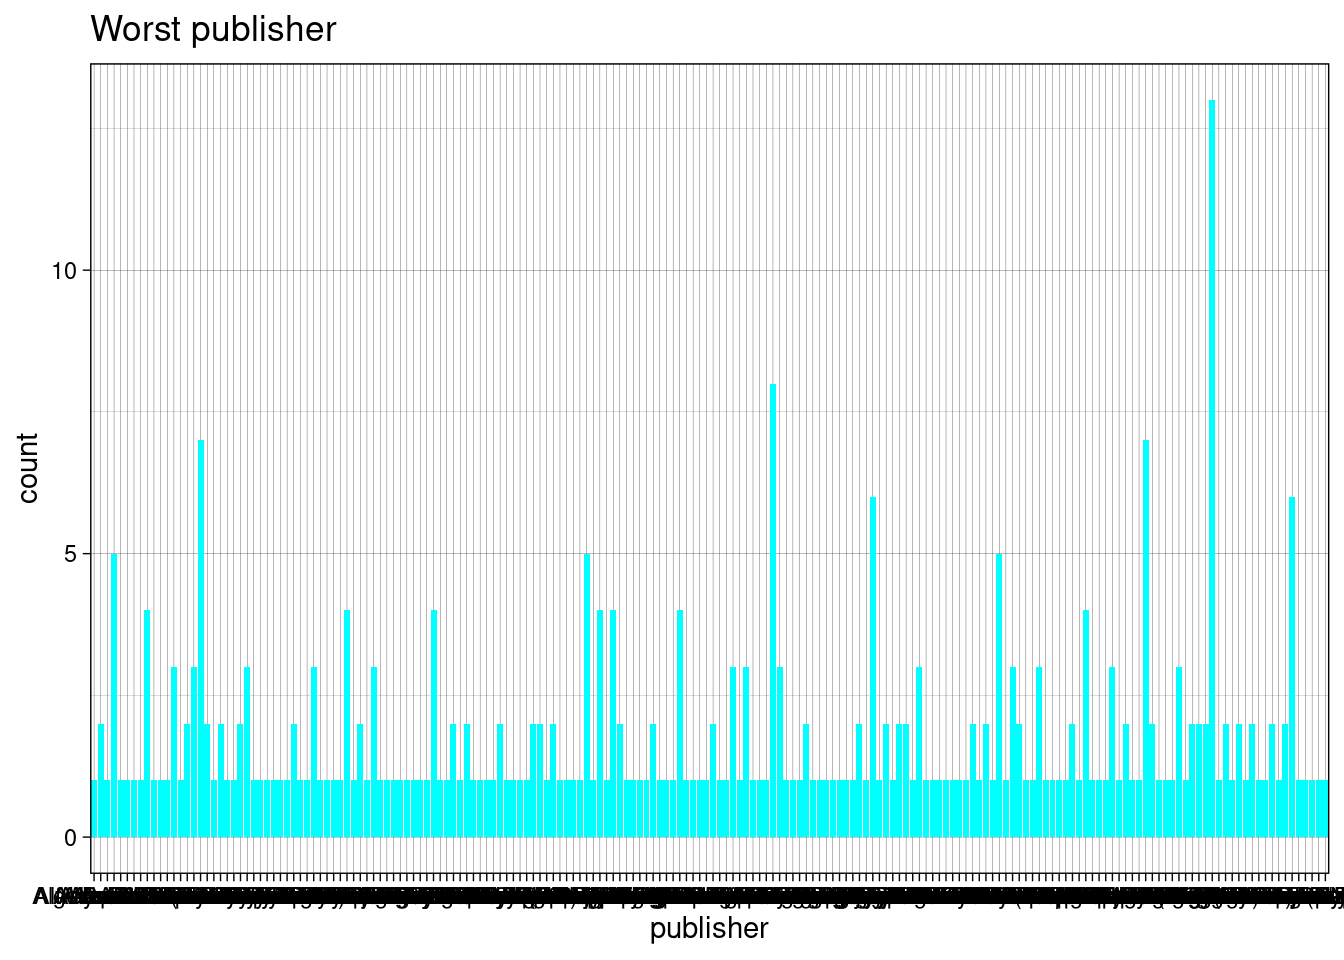
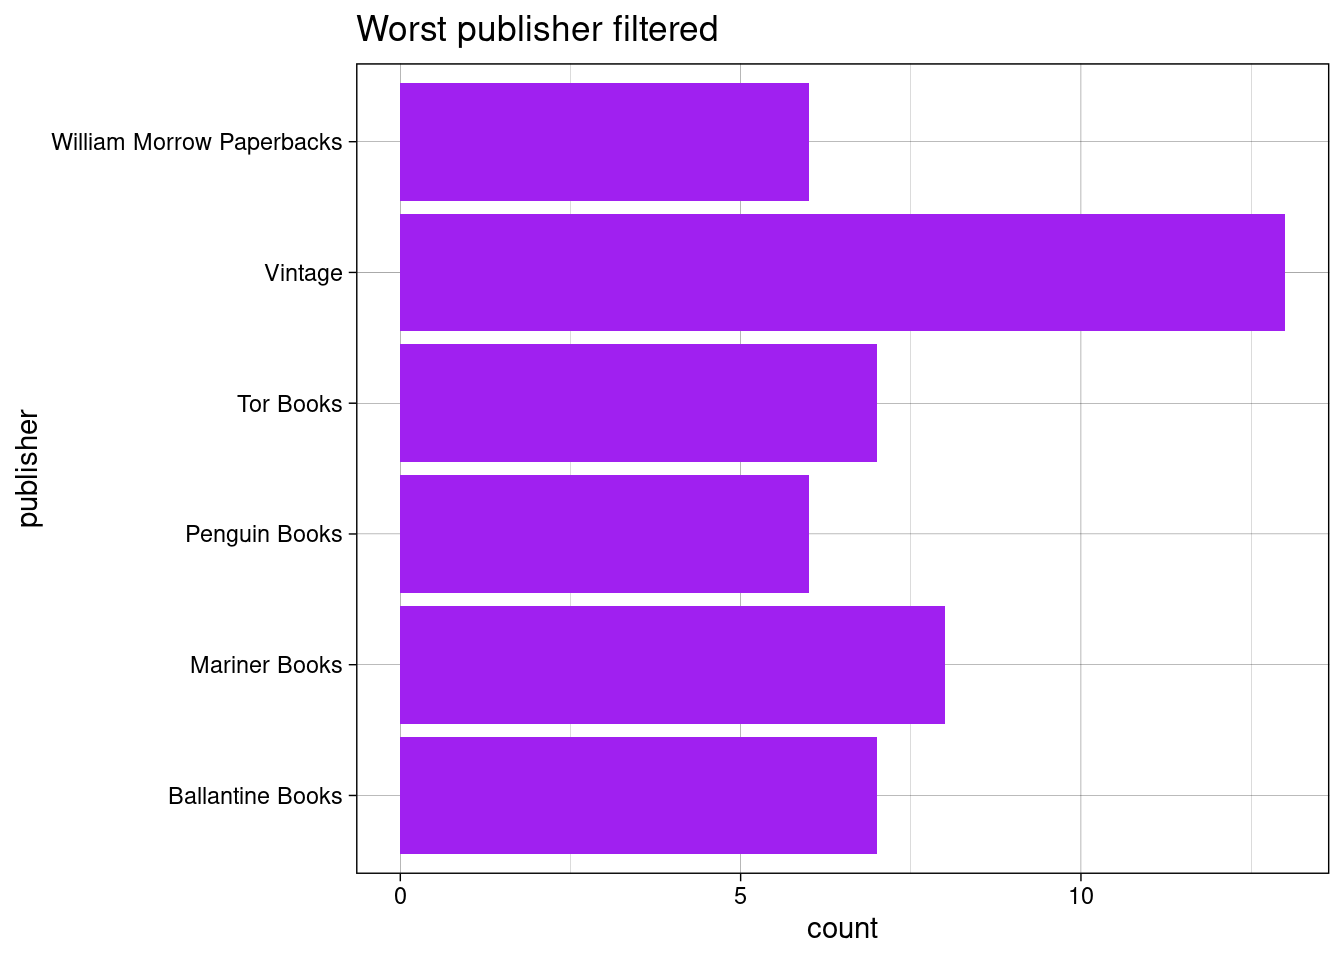
And to find out which publisher got the most amount of bad books…

books_eng_cleaned %>% 
ggplot(aes(x = publisher)) + 
  geom_bar(fill = "cyan") + 
  theme_linedraw()+ 
  labs(title = "Worst publisher")

This graph shows that we need to filter the number of publishers

publishers <- books_eng_cleaned %>%
  group_by(books_eng_cleaned$publisher) %>% 
  filter(n() > 5)
  
 publishers %>% 
    ggplot(aes(y = publisher)) + 
    geom_bar(fill = "purple") + 
    theme_linedraw()+ 
  labs(title = "Worst publisher filtered")