country year lifeExp gdpPercap
29 Australia 2025   84.18     66350
30  Colombia 2018   76.60      6817
31  Colombia 2019   76.80      6473
32  Colombia 2020   74.80      5340
33  Colombia 2021   72.70      5280
34 Colombia 2025 78.10 8562GDP vs Life Exp - CO vs AU comparision last 70 years
R
26Winter
data: gapminder.csv
Dataset
Selected dataset is gapminder but with 2015 to 2025 addition of Data from the World Bank Open Data
After that I make sure to charge all the libraries I used to processing the data
Then, the data was filtered to the selected countries for comparision and filtered for the relevant variables.
After that I added the new data to the set.
Context
Both countries have different socioeconomical context which implies serious differences in the data. I am focusing in a long term comparision plus focusing in something that affected all the world, being COVID-19 Pandemic.
Visualisation
Correlation between life expectancy and GDP per capita
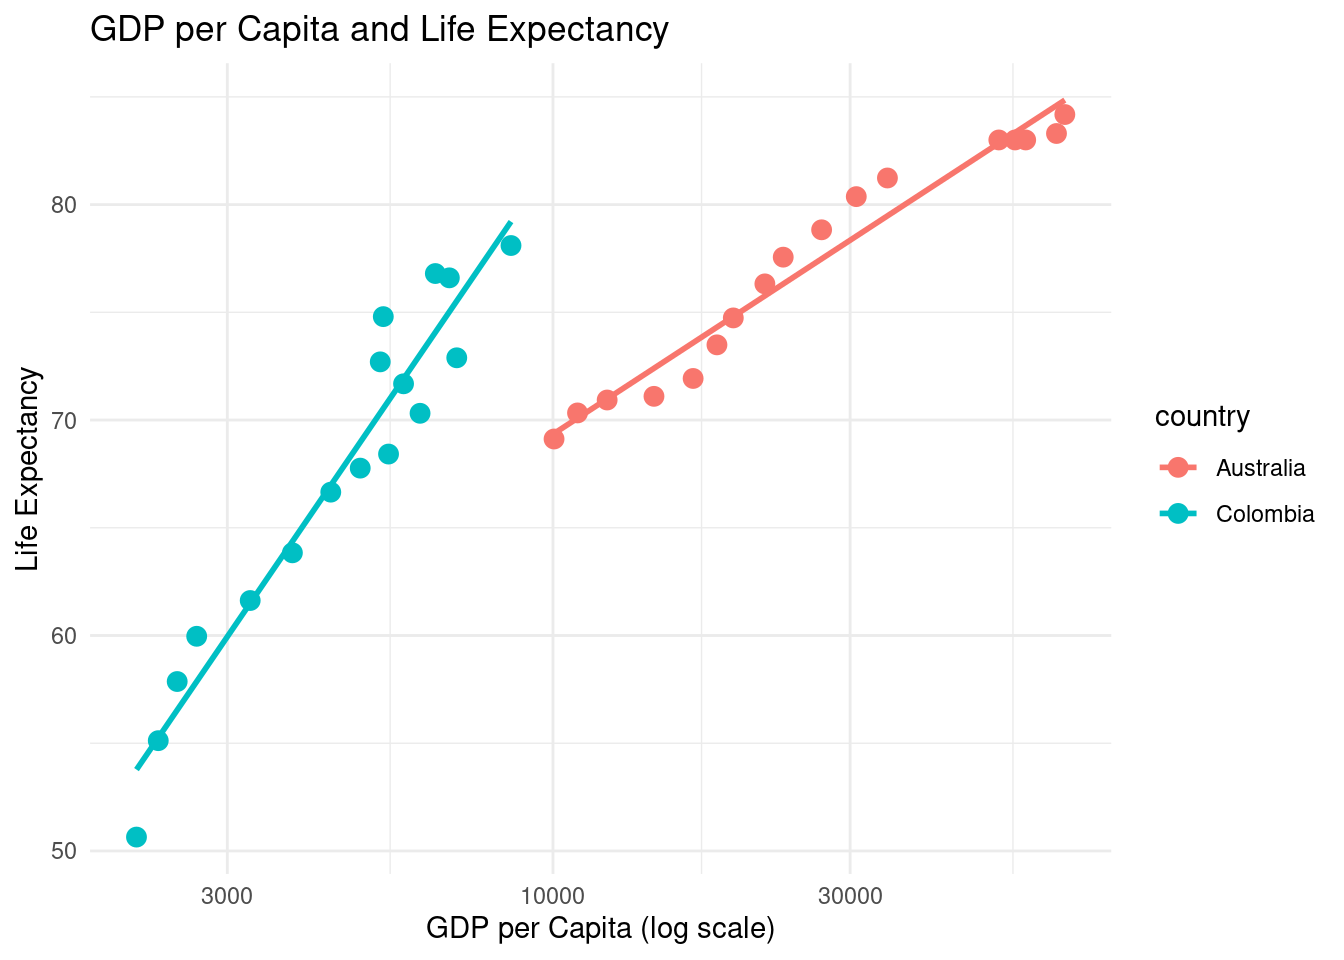
I also transform some data to percentage to make easier comparisions through years.
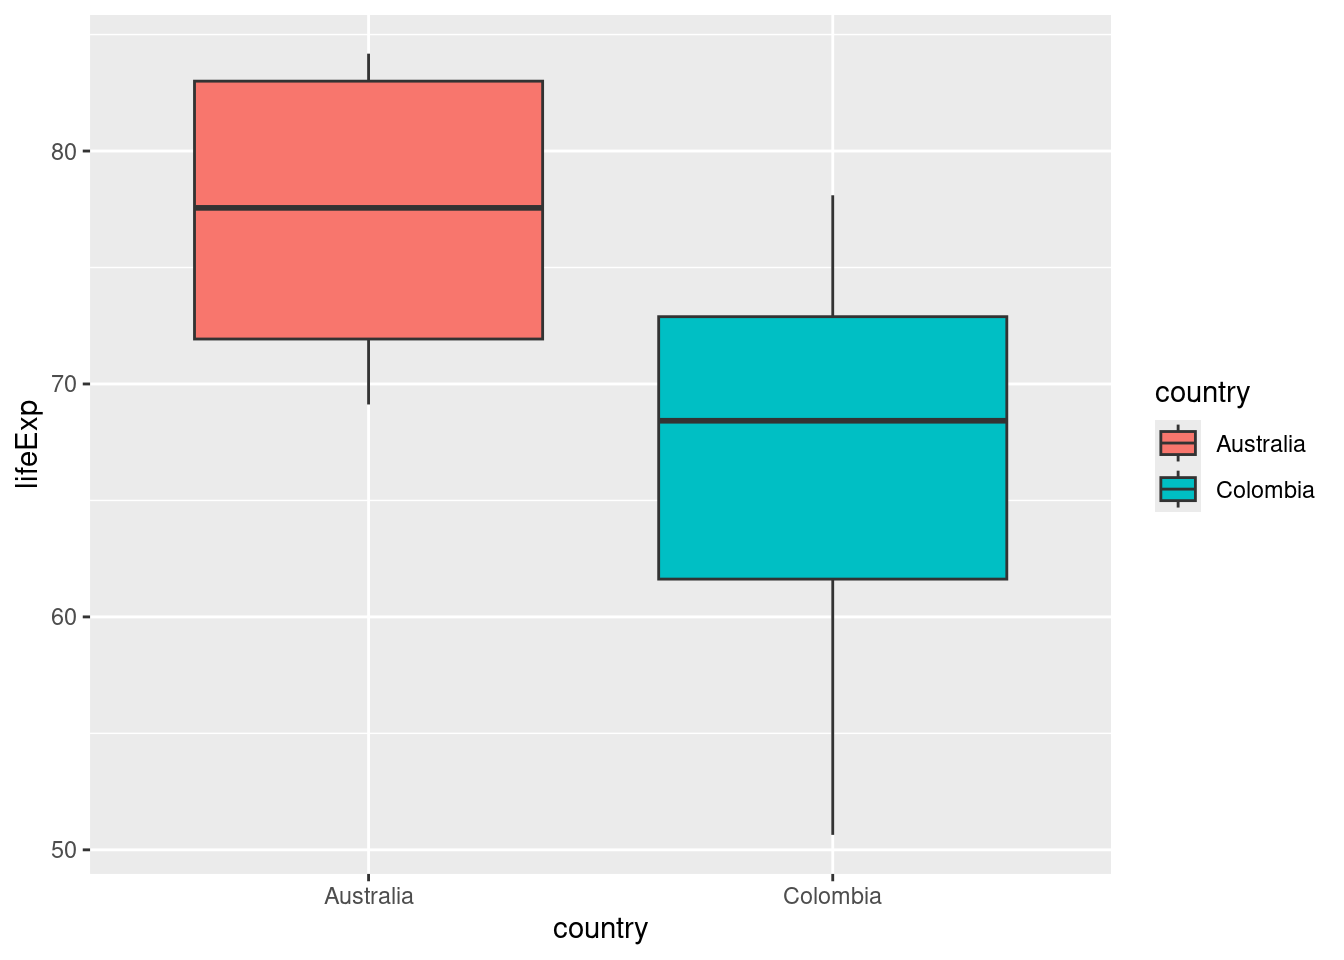
Life expectancy comparision
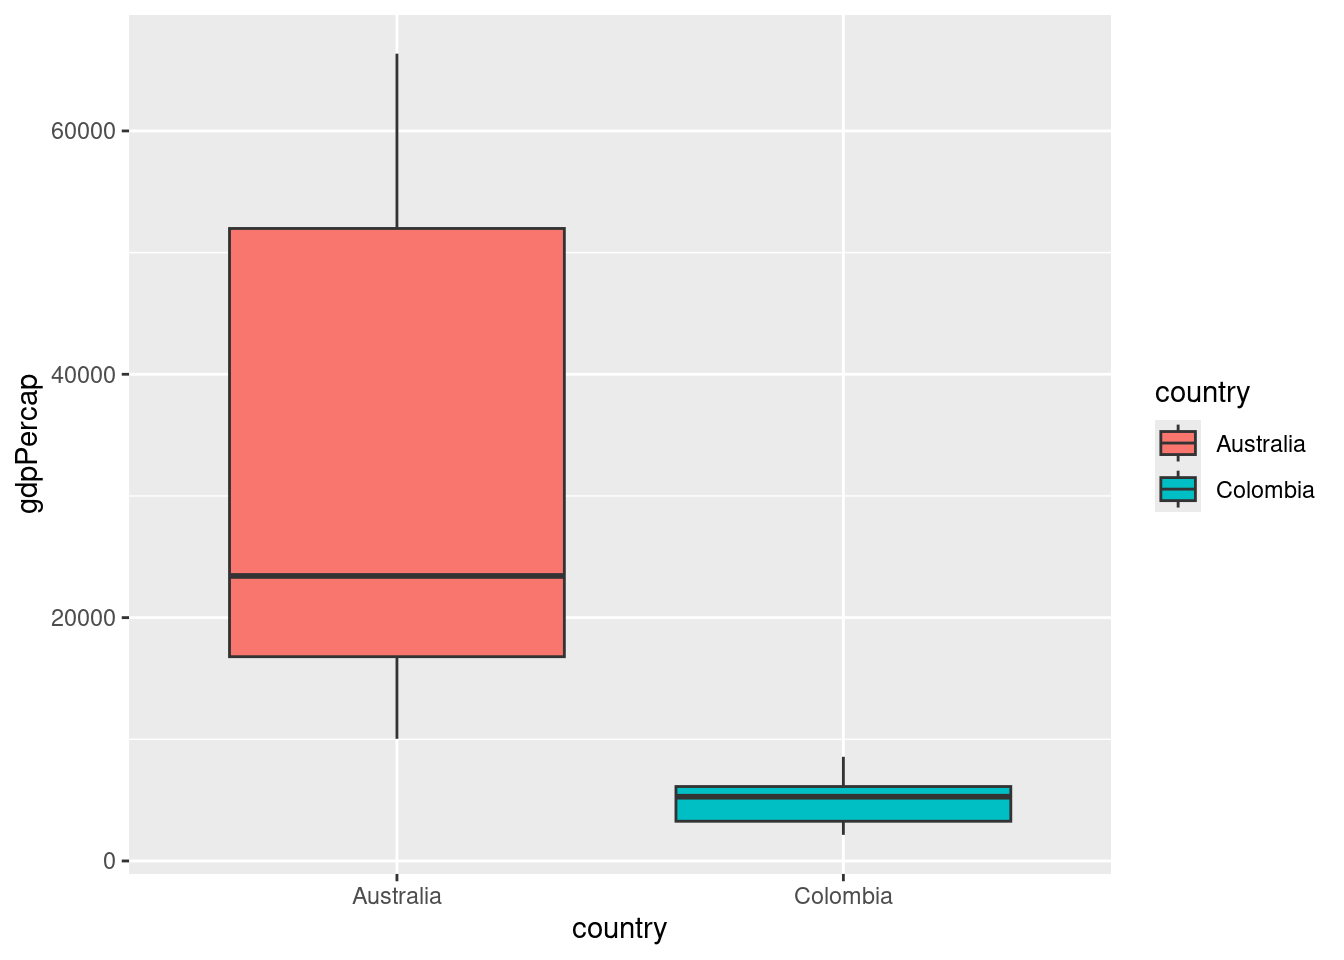
GDP per Capita comparision
Stats
Moderate to strong correlation between economic status or capability of a country and the life expectancy of its population.
Call:
lm(formula = lifeExp ~ gdpPercap + country, data = AUvsCO_small)

Residuals:
    Min      1Q  Median      3Q     Max
-15.981  -1.888  -0.004   3.118   9.653

Coefficients:
                  Estimate Std. Error t value Pr(>|t|)
(Intercept)      6.826e+01  2.646e+00  25.795  < 2e-16 ***
gdpPercap        2.841e-04  7.178e-05   3.957 0.000411 ***
countryColombia -2.247e+00  2.728e+00  -0.824 0.416472
---
Signif. codes:  0 '***' 0.001 '**' 0.01 '*' 0.05 '.' 0.1 ' ' 1

Residual standard error: 5.682 on 31 degrees of freedom
Multiple R-squared:  0.5692,    Adjusted R-squared:  0.5414
F-statistic: 20.48 on 2 and 31 DF,  p-value: 2.141e-06
[1] 0.5692375# A tibble: 2 × 2
country correlation
<chr> <dbl>
1 Australia 0.925
2 Colombia 0.936