book_data <- read.csv("../../../../data/books.csv")Good reads
R
26Summer
data: books.csv
Importing the data
Import the data:
Prepare the data
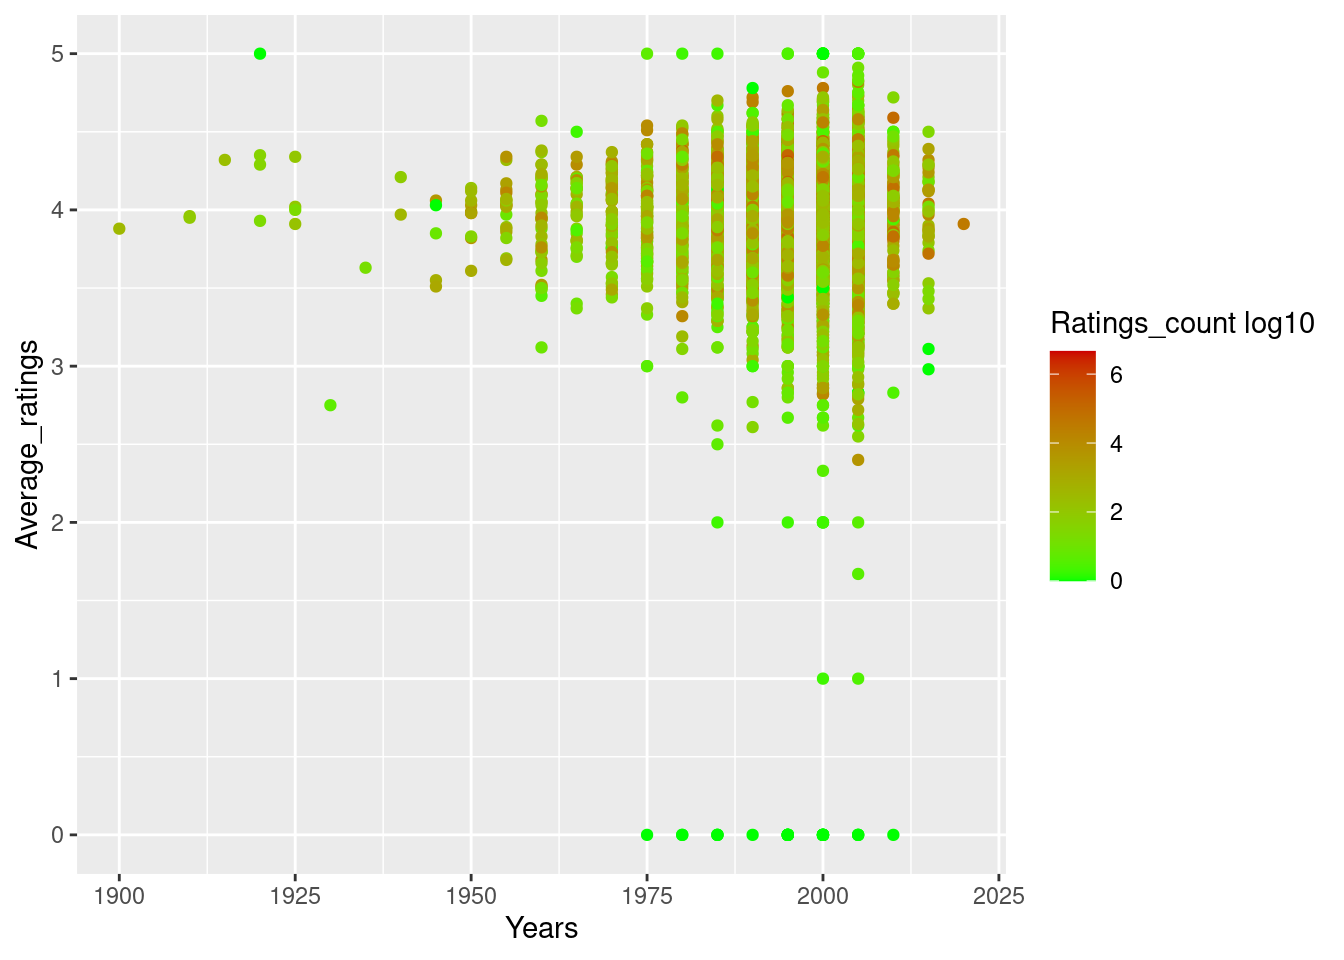
library(dplyr)Dividing years into five groups
rating <- book_data |>
  mutate(year1 = substr(publication_date, 1, 4),
          year = floor(as.integer(year1) / 5) *5 )
small_collect <- rating |>
select(average_rating,
ratings_count,
text_reviews_count,
year) |>
rename(Average_ratings = average_rating,
Years = year)
head(small_collect) Average_ratings ratings_count text_reviews_count Years
1 4.57 2095690 27591 2005
2 4.49 2153167 29221 2000
3 4.42 6333 244 2000
4 4.56 2339585 36325 2000
5 4.78 41428 164 2000
6 3.74 19 1 2005Let’s plot!
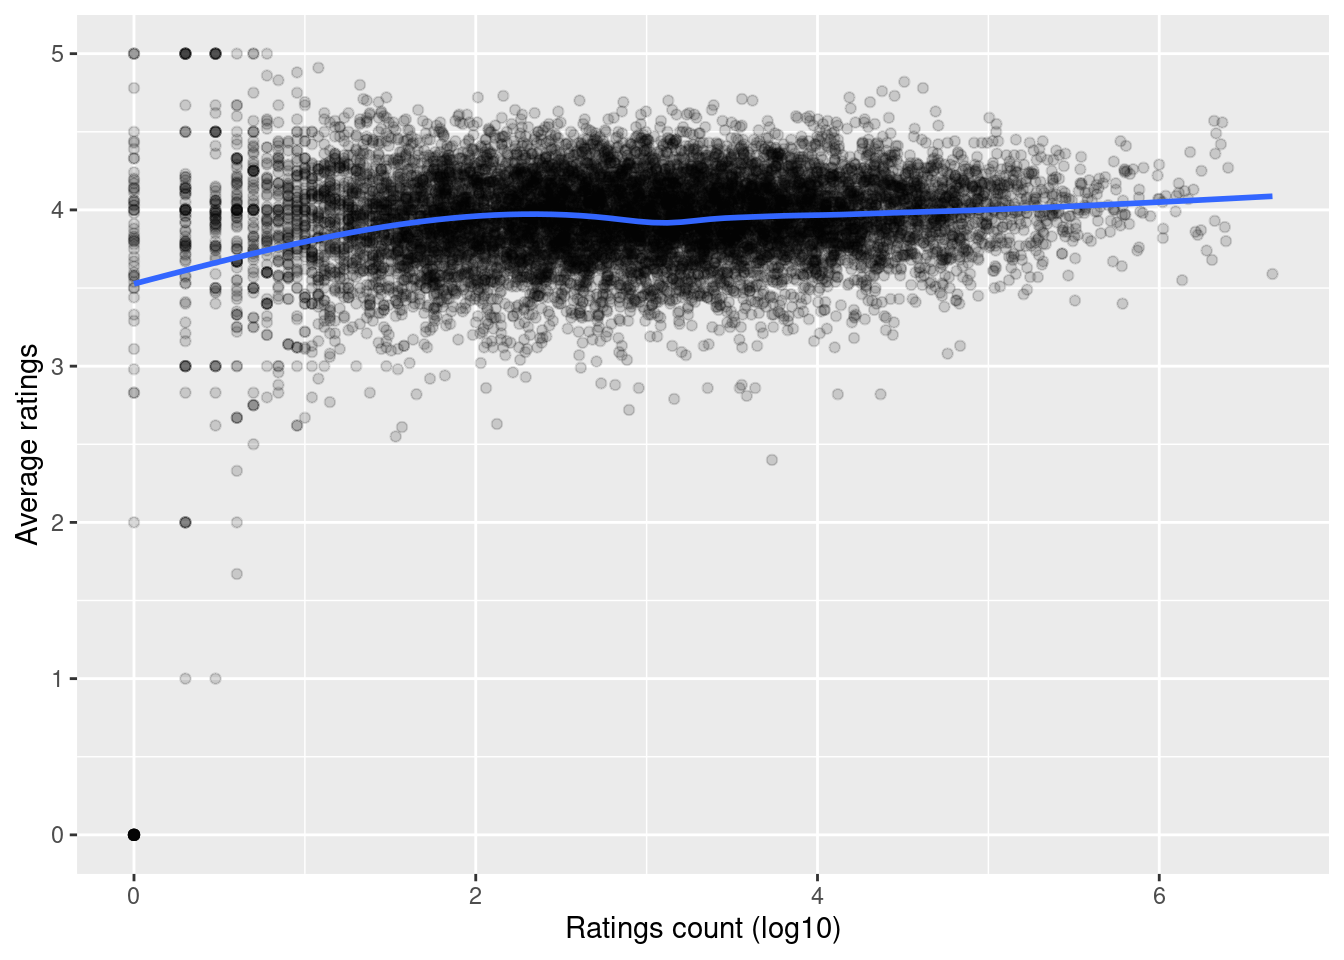
The overview
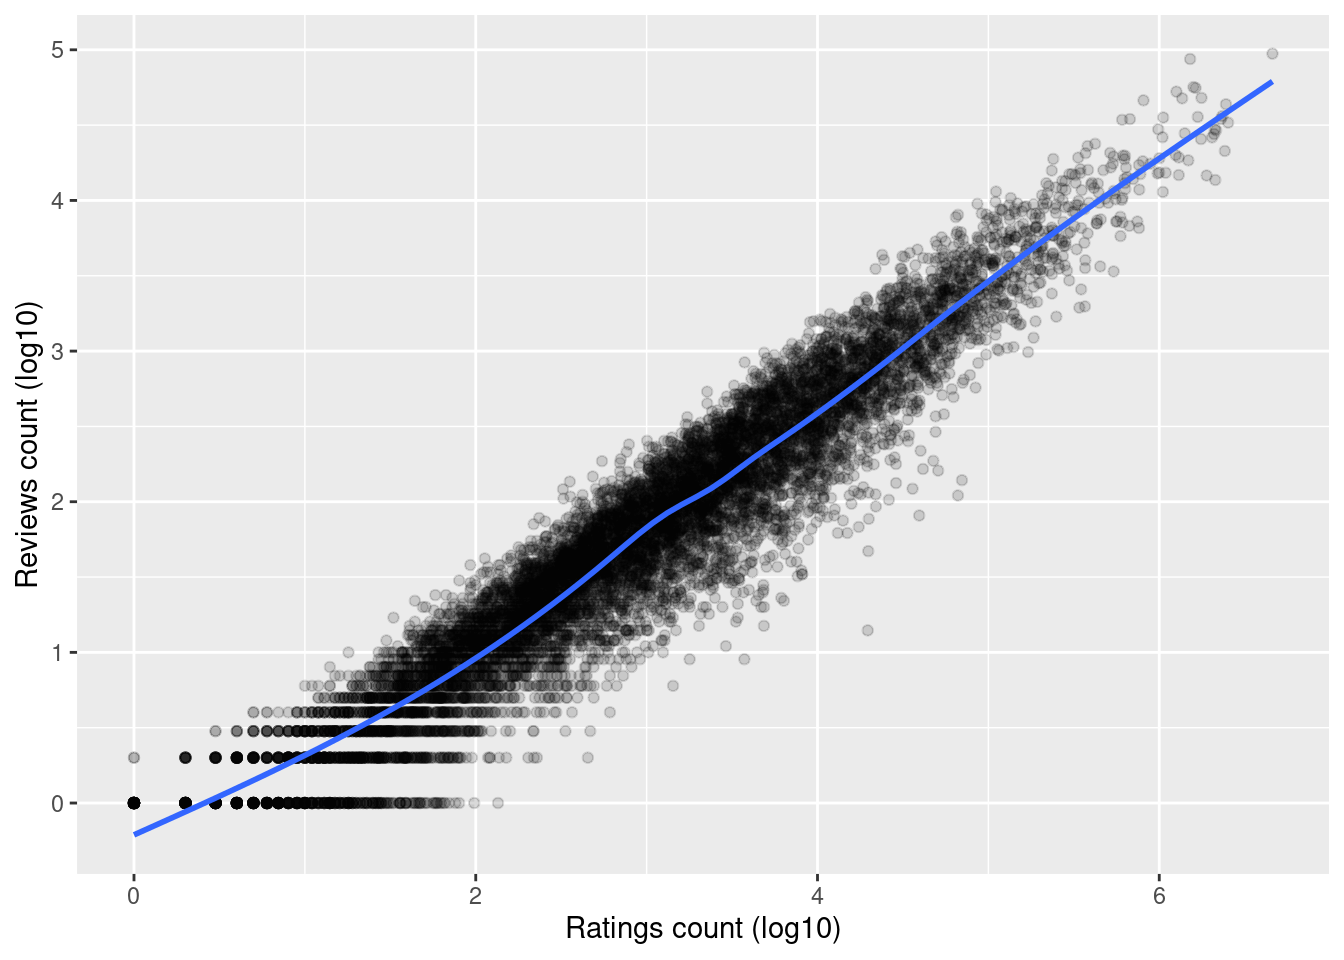
Relationship between rating counts and review counts
More comments more ratings?