library(plotly)Loading required package: ggplot2
Attaching package: 'plotly'The following object is masked from 'package:ggplot2':
last_plotThe following object is masked from 'package:stats':
filterThe following object is masked from 'package:graphics':
layoutlibrary(dplyr)
Attaching package: 'dplyr'The following objects are masked from 'package:stats':
filter, lagThe following objects are masked from 'package:base':
intersect, setdiff, setequal, unionlibrary(pheatmap)
library(ggplot2)
library(tidyr)
coffee_survey <- read.csv("../../../../data/coffee_survey.csv")
coffee_survey_pref <- drop_na(coffee_survey,prefer_overall)
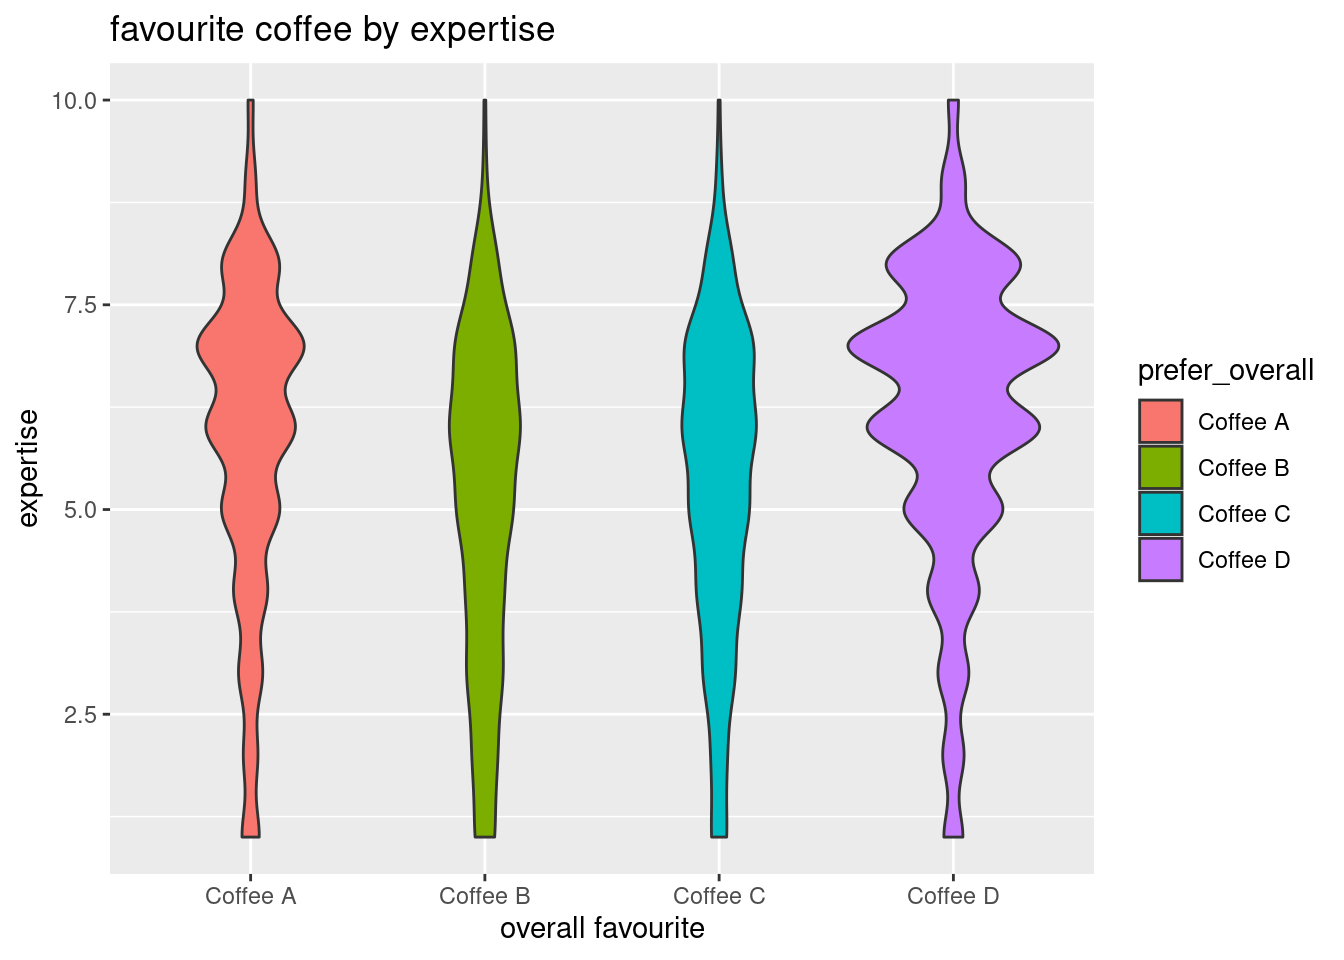
#experts prefer violin plot####
experts_prefer <- ggplot(data = coffee_survey_pref,
mapping = aes(x = prefer_overall,
y = expertise,
fill = prefer_overall)) +
geom_violin(scale = "count")+
labs(x = "overall favourite", y = "expertise", title = "favourite coffee by expertise")
experts_prefer