Open the data as a dataframe and look at the shape
import pandas as pddf = pd.read_csv("../../../../data/gapminder.csv")s = df.shape print(f'There are {s[0]} rows and {s[1]} columns')c_names = df.columns.tolist()print("The headings are: ")for c in c_names:print(f'- {c}')
There are 1704 rows and 6 columns
The headings are:
- country
- year
- pop
- continent
- lifeExp
- gdpPercap
Get a summary of the numerical data
df.describe()
year
pop
lifeExp
gdpPercap
count
1704.00000
1.704000e+03
1704.000000
1704.000000
mean
1979.50000
2.960121e+07
59.474439
7215.327081
std
17.26533
1.061579e+08
12.917107
9857.454543
min
1952.00000
6.001100e+04
23.599000
241.165876
25%
1965.75000
2.793664e+06
48.198000
1202.060309
50%
1979.50000
7.023596e+06
60.712500
3531.846988
75%
1993.25000
1.958522e+07
70.845500
9325.462346
max
2007.00000
1.318683e+09
82.603000
113523.132900
Check for null values and data types.
df.info()print("There are no null values that would have been removed in data cleaning.")
<class 'pandas.core.frame.DataFrame'>
RangeIndex: 1704 entries, 0 to 1703
Data columns (total 6 columns):
 #   Column     Non-Null Count  Dtype
---  ------     --------------  -----
 0   country    1704 non-null   object
 1   year       1704 non-null   int64
 2   pop        1704 non-null   float64
 3   continent  1704 non-null   object
 4   lifeExp    1704 non-null   float64
 5   gdpPercap  1704 non-null   float64
dtypes: float64(3), int64(1), object(2)
memory usage: 80.0+ KB
There are no null values that would have been removed in data cleaning.
Unique values for potential catagories
Check Country first
all_countries = df.country.unique().tolist()
print(f'This data has {len(all_countries)} different countries')
This data has 142 different countries
Check Continent next
all_continents = df.continent.unique().tolist()print(f"This data has {len(all_continents)} different continents")
This data has 5 different continents
Also check years
all_years = df.year.unique().tolist()print(f"This data has {len(all_years)} different years")for y in all_years:print(y)
This data has 12 different years
1952
1957
1962
1967
1972
1977
1982
1987
1992
1997
2002
2007
Summary
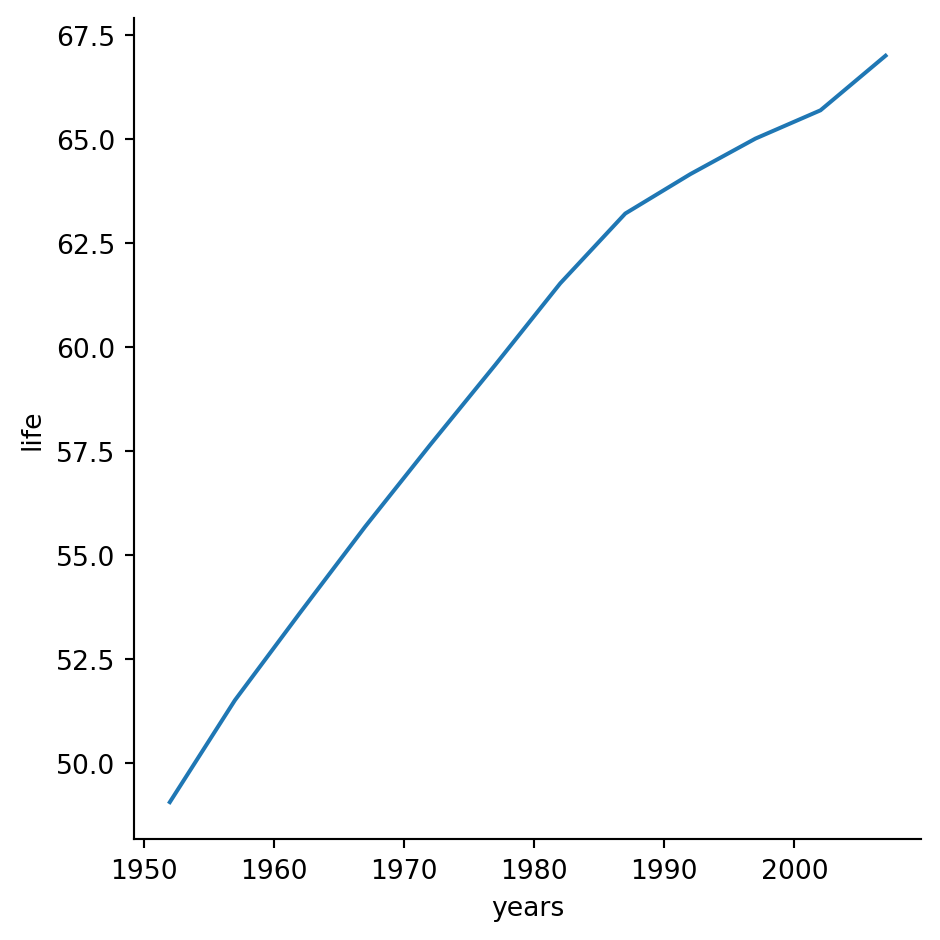
We have data from 1952 to 2007 accross 142 countries and 5 continents. Each of these has population, life expectancy and GDP. I will see if I can find any links for life expectancy based on years.
Years vs Life Expectancy
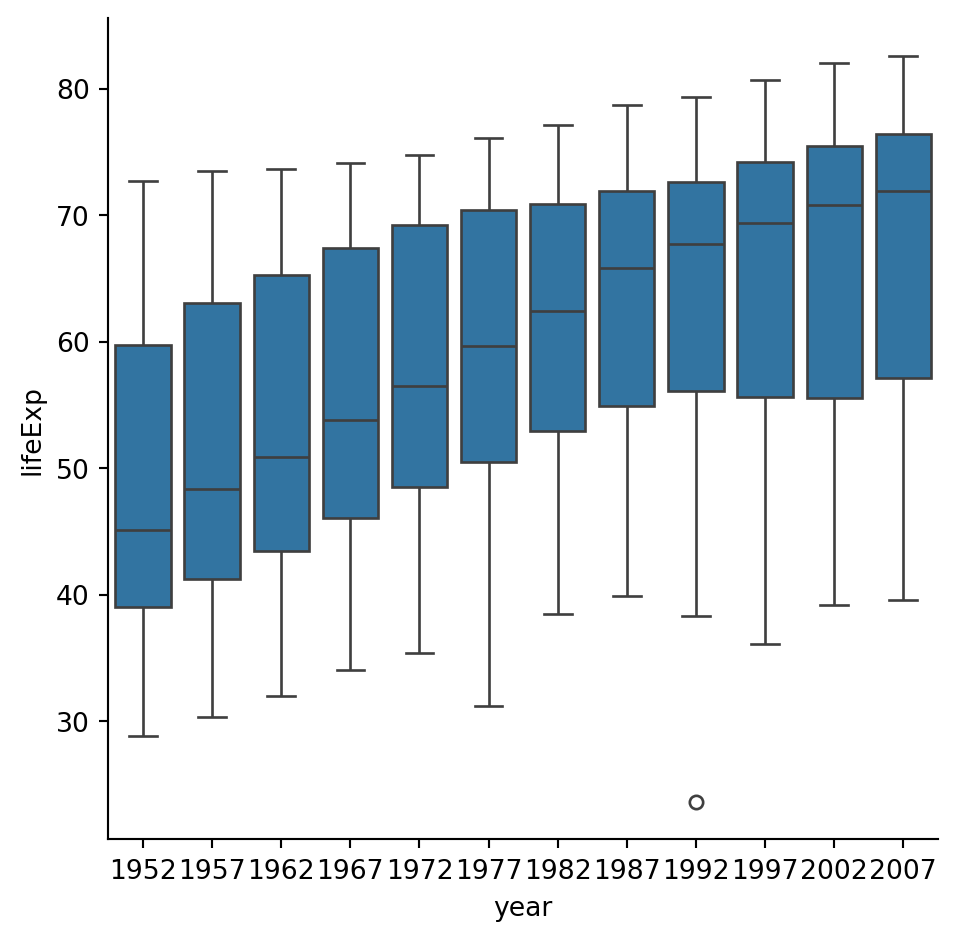
import seaborn as snssns.catplot(data=df, x="year", y="lifeExp", kind="box")
It appears that life expectancy increased with time but I will do a deeper dive
Null hypothesis - there is no difference in life expectancy between 1957 and 2007
I will perform a ttest to check this
import scipy.stats as statsearly = df[df.year ==1957]late = df[df.year ==2007]check = stats.ttest_ind(early.lifeExp, late.lifeExp)print(f'The pvalue is {check.pvalue}.')
The pvalue is 8.299952773896099e-23.
Result
There is a very low pvalue indcating that we can reject the null hypothesis there is no difference in life expectancy between 1952 and 2007.
Look at outlier 1992
life_year = df[(df.year ==1992)]min_exp_92 = life_year.lifeExp.min()min_country = life_year.country[life_year.lifeExp == min_exp_92].tolist()print(f'The 1992 outlier is {str(min_country[0])} with a life expectancy of {min_exp_92}')
The 1992 outlier is Rwanda with a life expectancy of 23.599
In 1992 there was a 100 day civil war in Rwanda that led to the genocide of nearly 1 million people. Source