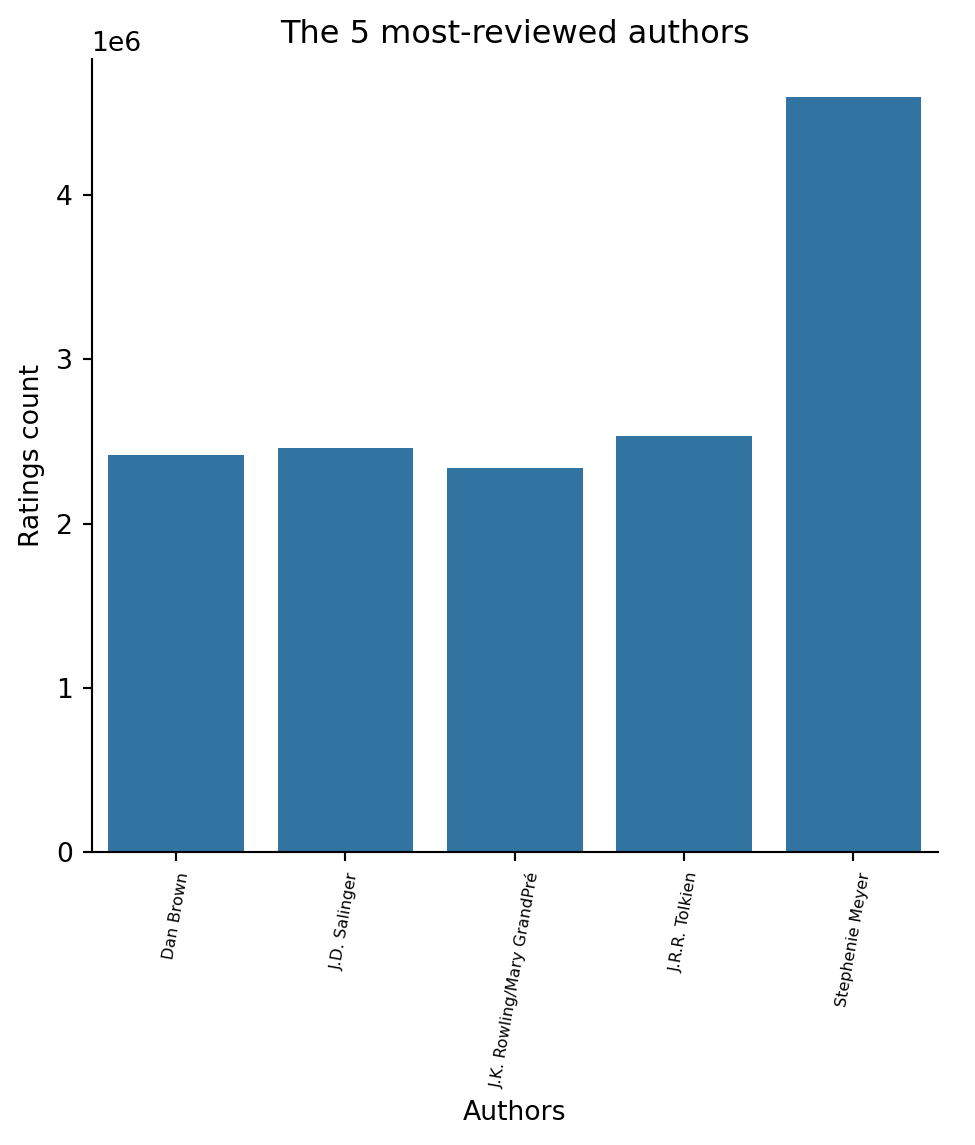
We are looking into the data set named A summary of books on Goodreads and try to make a graph of 5 most-reviewed authors from it.
import pandas as pddf_raw=pd.read_csv("../../../../data/books.csv")df=df_raw.copy()#Describe the data setdf.dtypesdf.describe()df["authors"].describe()df["ratings_count"].describe()#Sort data based on ratings_count, get the top 5 from that dataframedf_sort=df.sort_values(by="ratings_count",ascending=False)top_5 = df_sort.nlargest(5, 'ratings_count')#groupby authors based on the top 5gb=top_5.groupby("authors")avg_by_authors=gb["ratings_count"].agg("mean")import seaborn as snsimport matplotlib.pyplot as plt#convert the series into a dataframedf_top5= avg_by_authors.to_frame()#plot the top 5sns.catplot(data=df_top5,x="authors",y="ratings_count",kind="bar")#modify the plotplt.ylabel("Ratings count")plt.xlabel("Authors") plt.title("The 5 most-reviewed authors")plt.xticks(fontsize=6, rotation=80)