Heading of level 2
This is a paragraph of wfh by Favourite Type Group.
Import the data
We import the players dataset
import matplotlib.pyplot as plt
import pandas as pd
import plotly.express as px
import seaborn as sns

df = pd.read_csv("../../../../data/coffee_survey.csv")


df.head()

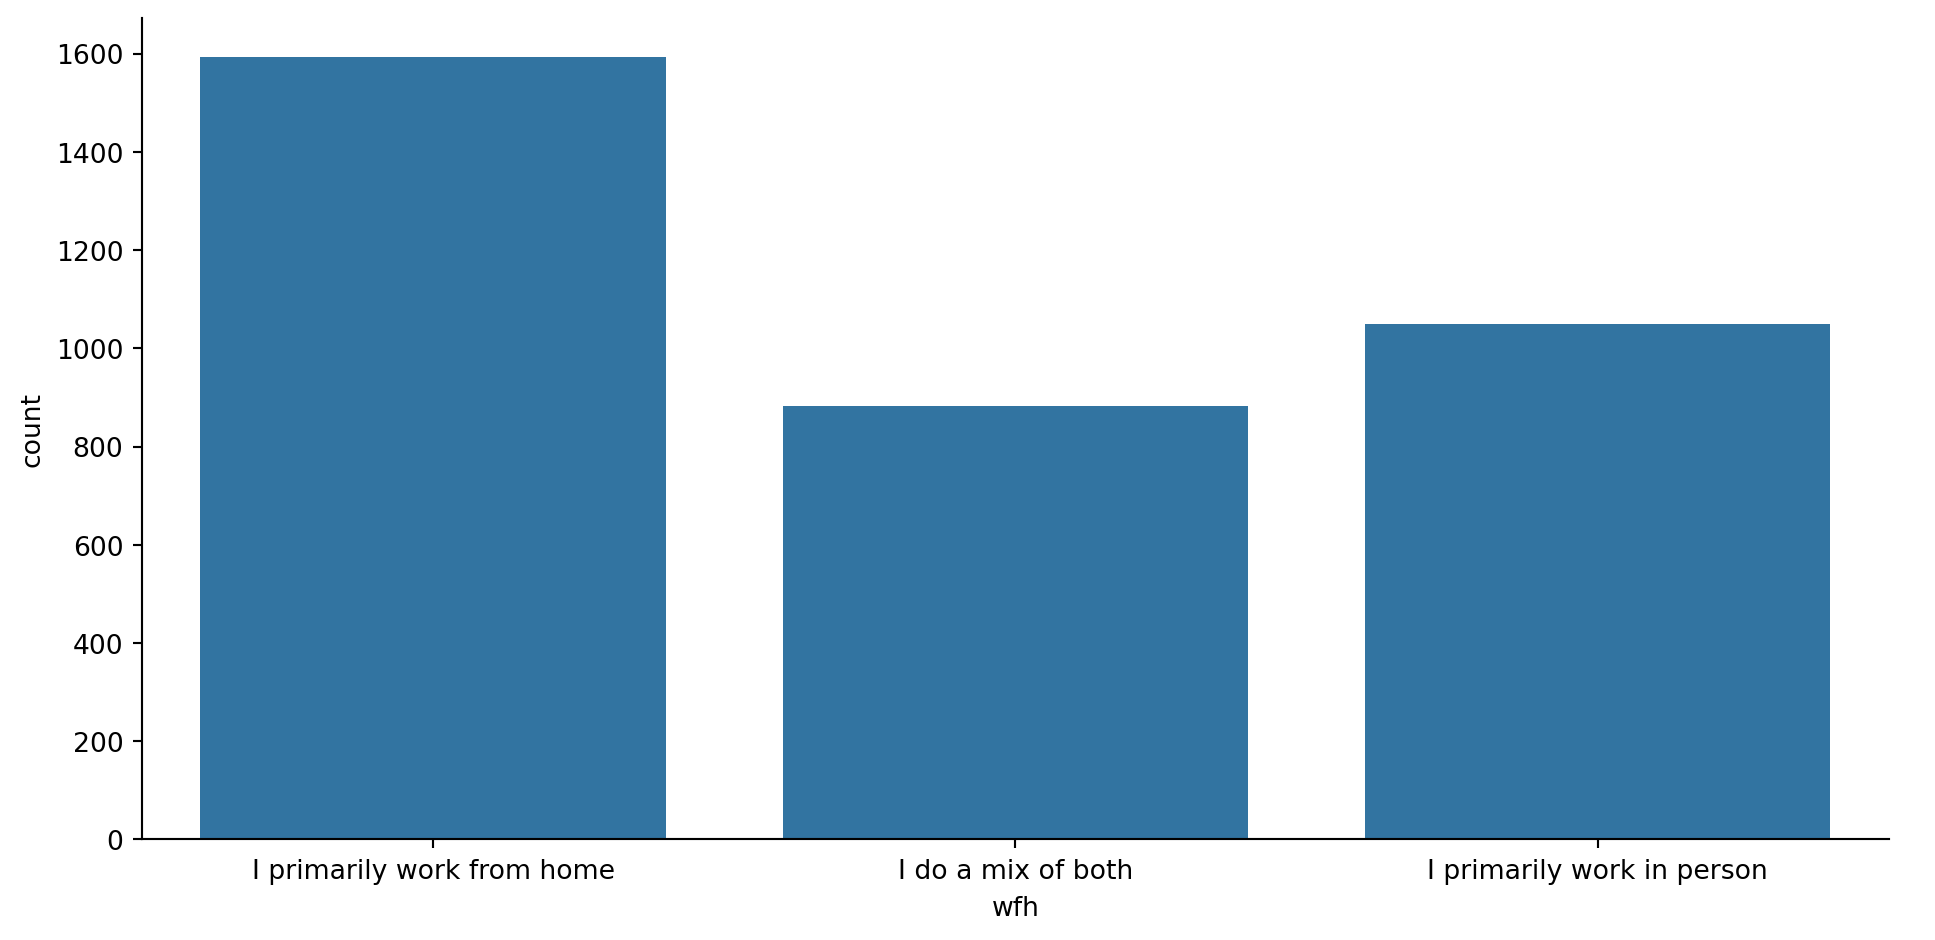
sns.catplot(data = df, x = "wfh", kind="count", height=5, aspect=2)


df_focused = df[["age", "where_drink", "favourite", 'wfh']].copy()
df_focused.head(10)

df_focused['wfh'] = df_focused['wfh'].fillna('')
df_focused['wfh']=df_focused['wfh'].str.split(pat=", ")
df_focused.head()

df_exploded = df_focused.explode('wfh')
dummies = pd.crosstab(df_exploded.index, df_exploded['wfh'])
df_final = df_focused.join(dummies.groupby(dummies.index).sum())
df_final.head()

groupby_age = df_final.groupby('age')[df_final.select_dtypes(include='number').columns].mean()
groupby_age.head()

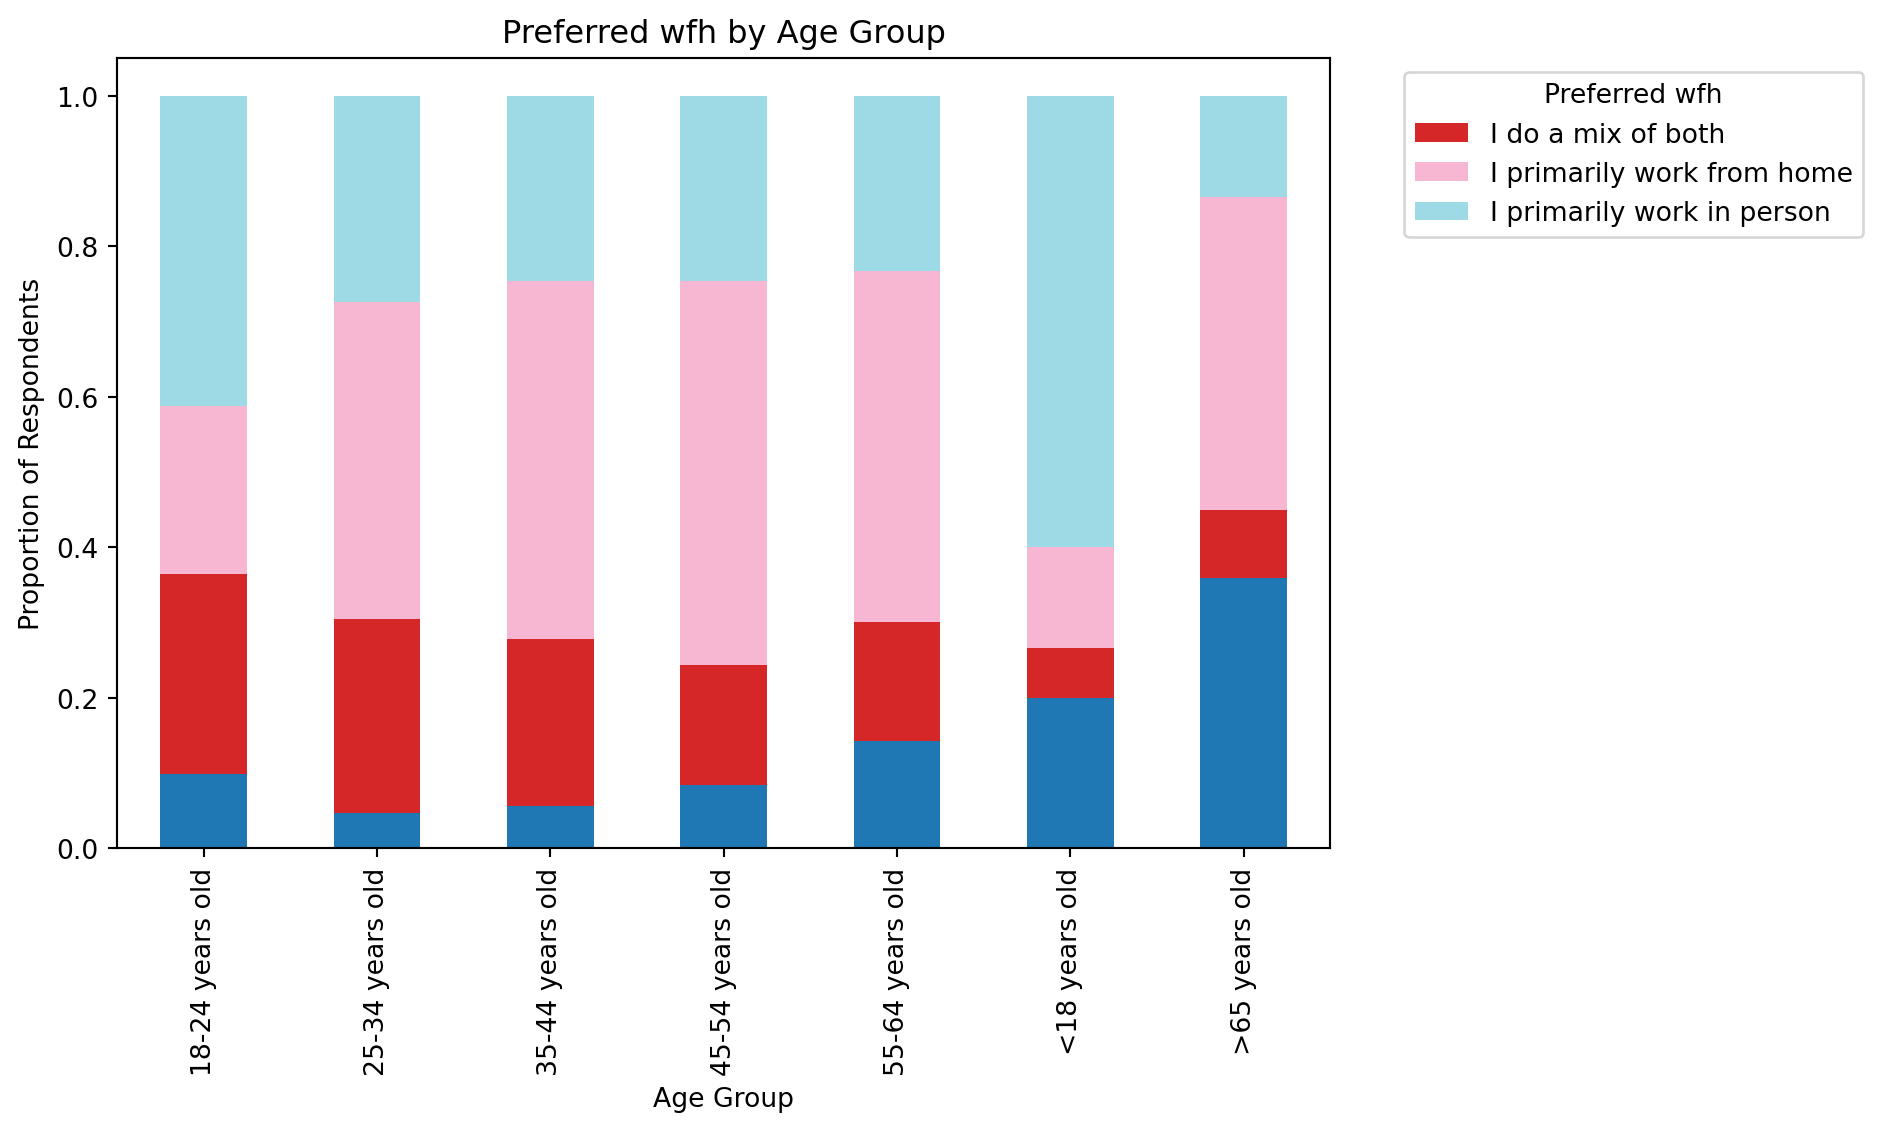
groupby_age.plot(kind='bar', stacked=True, figsize=(10,6), colormap='tab20')
plt.title('Preferred wfh by Age Group')
plt.ylabel('Proportion of Respondents')
plt.xlabel('Age Group')
plt.legend(title='Preferred wfh', bbox_to_anchor=(1.05, 1), loc='upper left')
plt.tight_layout()
plt.show()


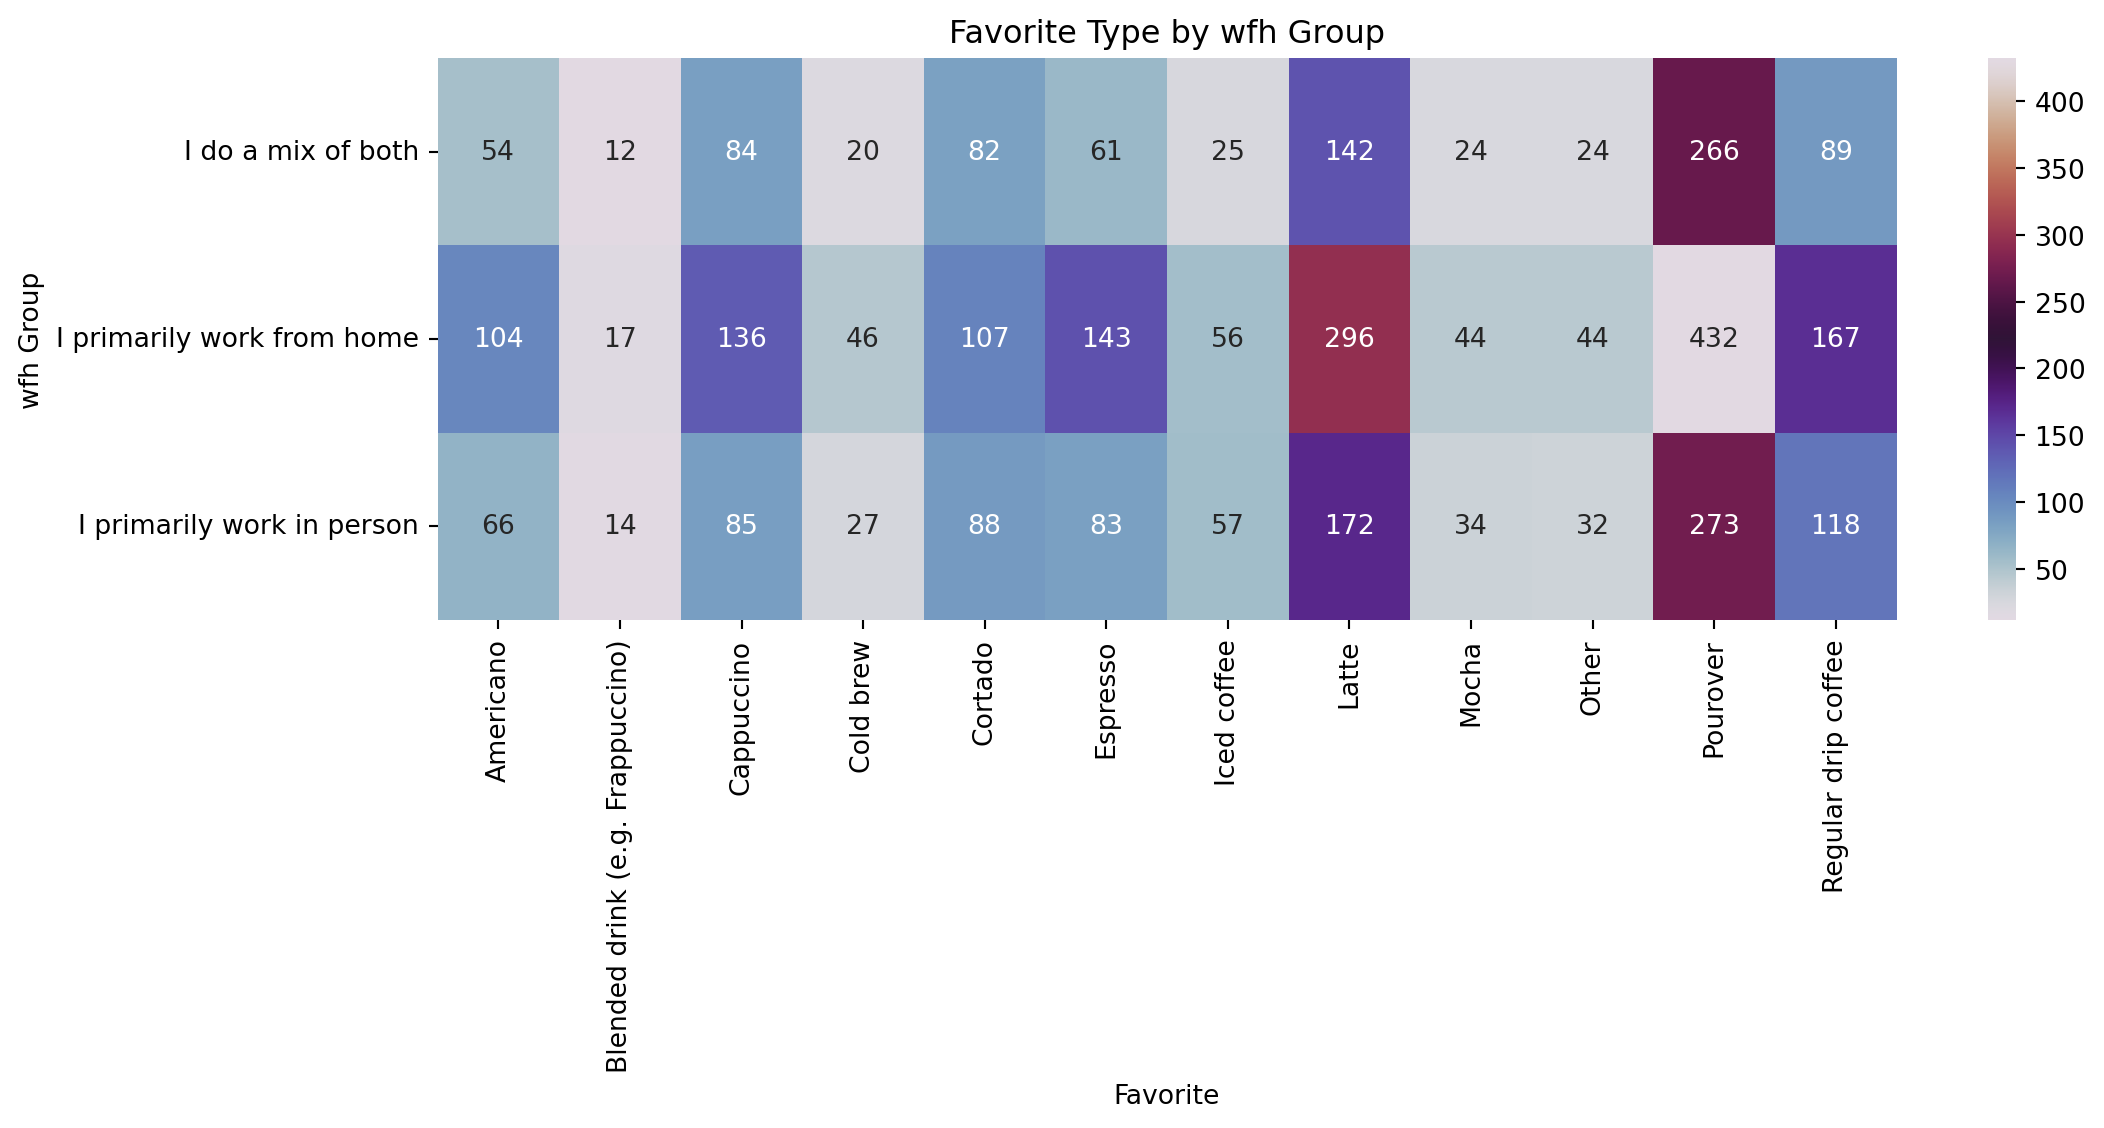
favourite_by_wfhgroup = df.groupby('wfh')['favourite'].value_counts().unstack().fillna(0)

plt.figure(figsize=(12, 6))
sns.heatmap(favourite_by_wfhgroup, annot=True, fmt='.0f', cmap='twilight')
plt.title('Favorite Type by wfh Group')
plt.ylabel('wfh Group')
plt.xlabel('Favorite')
plt.tight_layout()
plt.show()

df.head()

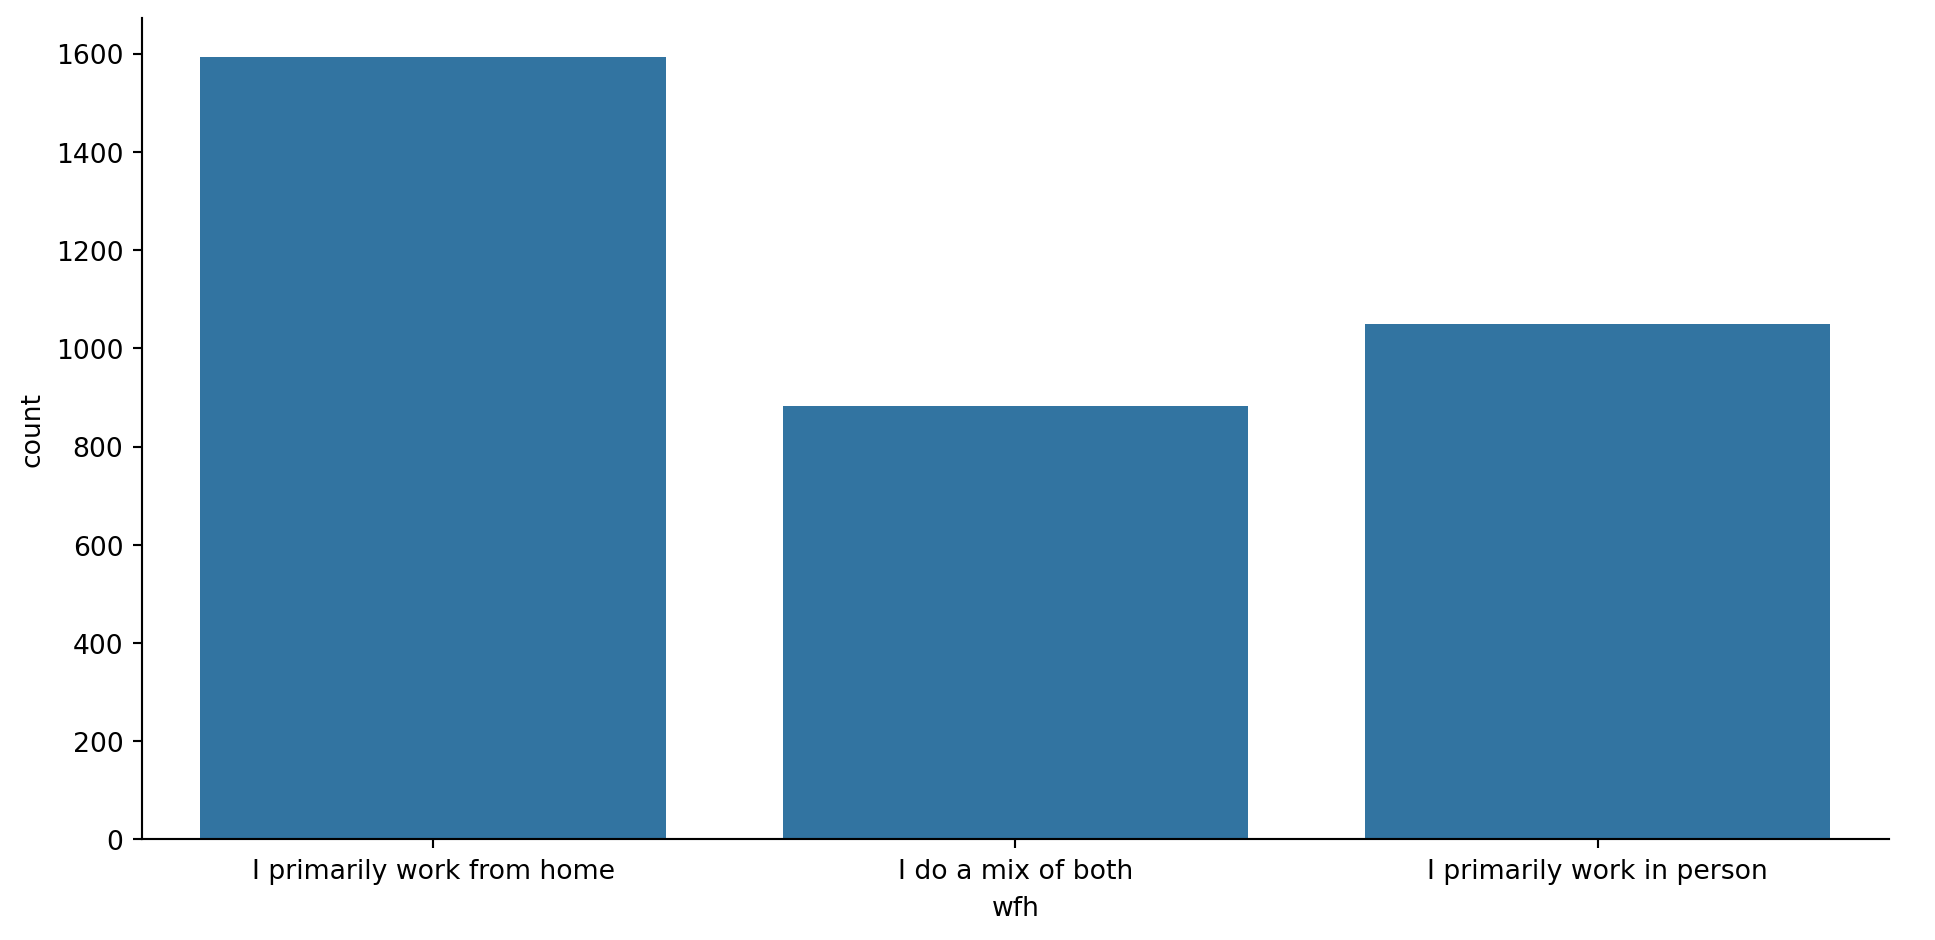
sns.catplot(data = df, x = "wfh", kind="count", height=5, aspect=2)


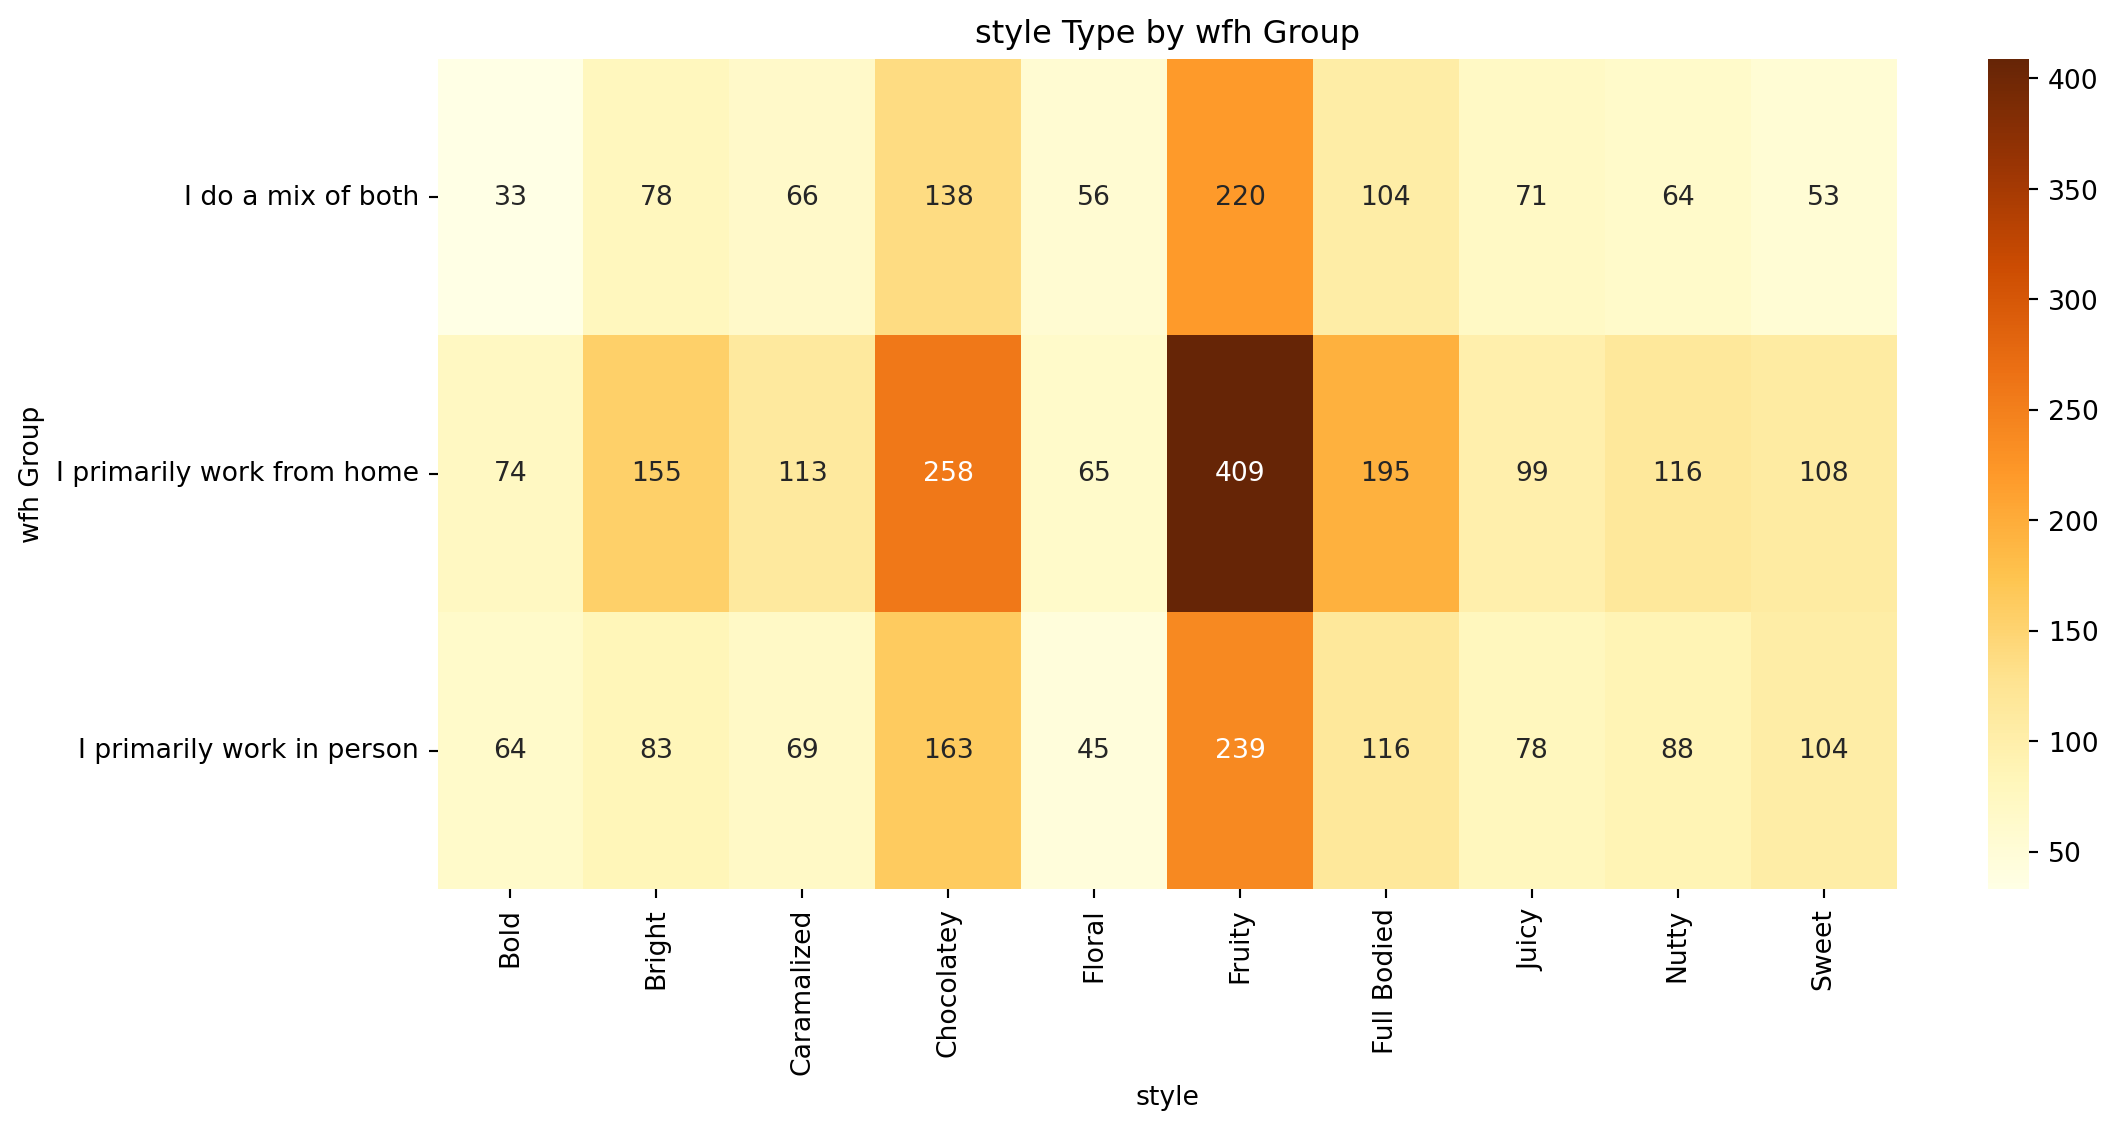
style_by_wfhgroup = df.groupby('wfh')['style'].value_counts().unstack().fillna(0)

plt.figure(figsize=(12, 6))
sns.heatmap(style_by_wfhgroup, annot=True, fmt='.0f', cmap='YlOrBr')
plt.title('style Type by wfh Group')
plt.ylabel('wfh Group')
plt.xlabel('style')
plt.tight_layout()
plt.show()